雅思写作笔记——Simon Task1
雅思写作Task1
Simon Lesson 1:课程目标
- 方法和技巧
- 将任务进行不同样例的解读
- 问题的类型
1、如何写好task1:
- task1的要求是形容你看到的图表,写一封报告,而不要给观点。
也即不要试图分析这种趋势背后的原因
- 不要给结论,但是可以做一个总结(在overview部分)
2、Task1的六种题型:
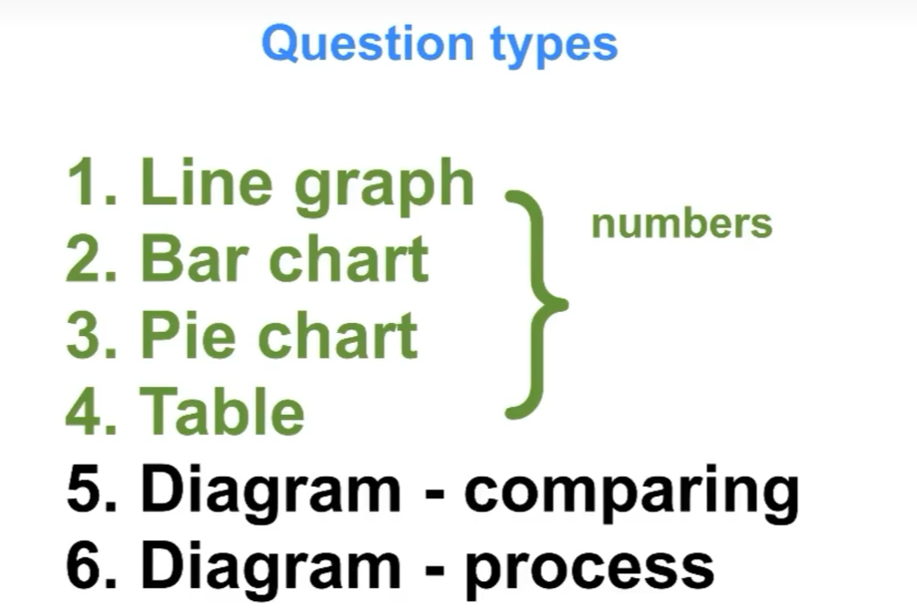
对于前四种题型所用的技巧和方法都完全一致:
- 描述
- 对比
- 对于变化或趋势做出说明
第五种其实使用的语言相似
第六种流程图就格外不同,后面会专门讲到
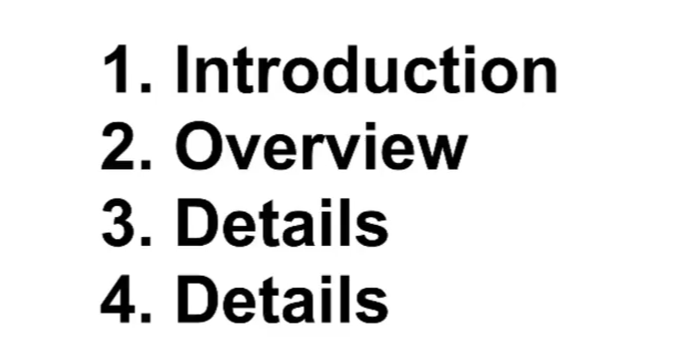
3、Task1的四段式结构:
-
Introduction
![]()
-
Overview
![]()
-
Details
![]()

Simon Lesson 2:Line graphs
1、概述:
通常线条图会有三四条线段,x轴为时间变换,y轴为数量变换。我们的任务就是对比这些线段,而非分开描述每一条。
2、两点原则:
- 进行总体上的比较:summary/overview paragraphs
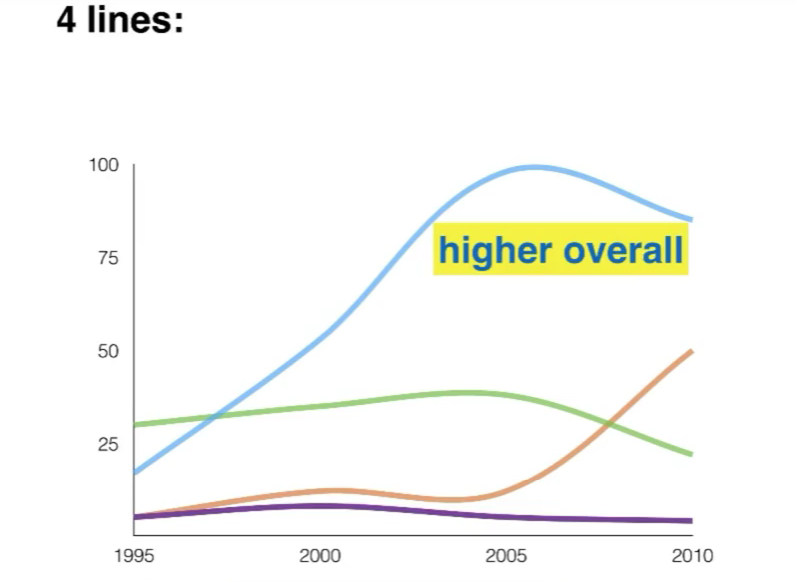
选择总体上非常一致的现象,例如蓝色线条在很长的时间内都比其他的要高
- 比较特定点的线条:details paragraphs
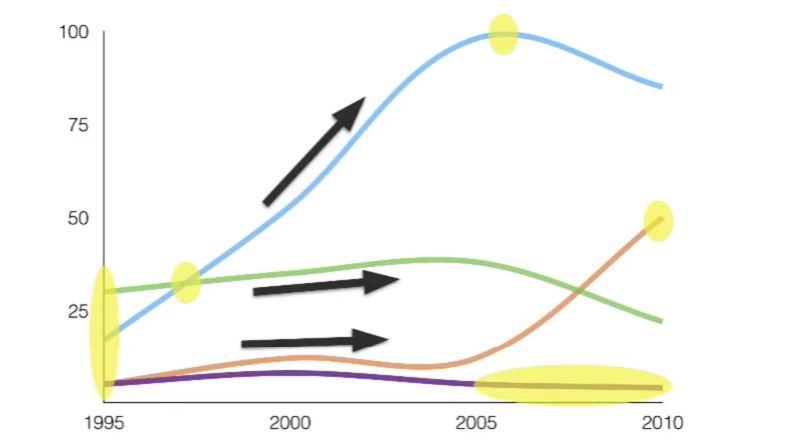
选择局部的时间点,例如最开始的时间点、蓝色线和绿色线的交点及之后的发展趋势、每个线段的峰值以及长期稳定不变的时间
Simon给出的建议是:因为字数的限制,我们不能够描述所有的事情,因此每条线至少写一件事,并且进行相关比较
3、Line graphs案例展示:
3.1 Introduction:对于问题进行意译
3.2 Overview:2句话、2个观点
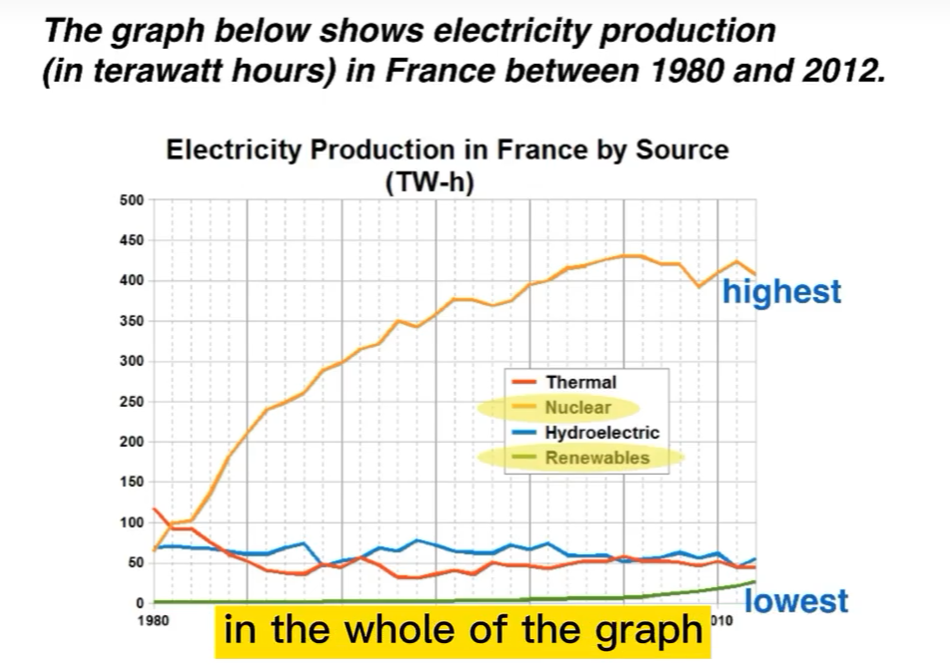
It is clear that nuclear power was by far the most important means of electricity generation over theperiod shown. Renewables provided the lowestamount of electricity in each year.
3.3 Details 1:
选取开始的时间点和Nuclear超越Thermal的时间点作为本段的内容
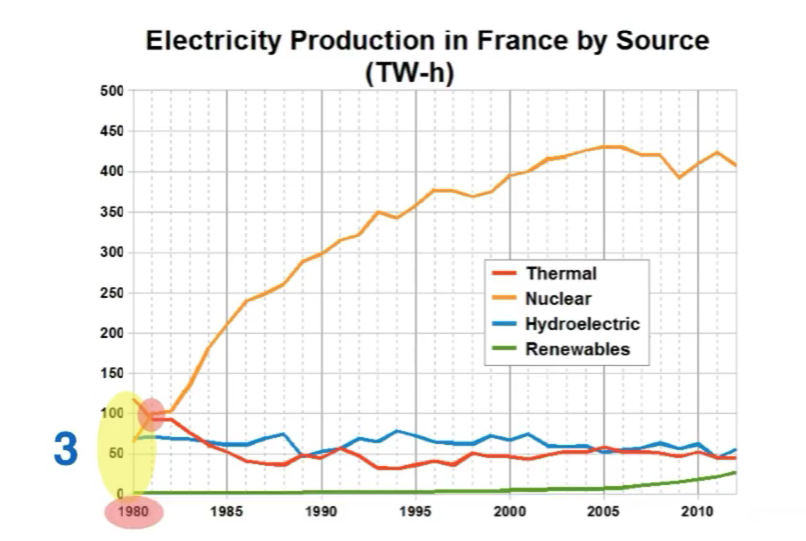
In 1980, thermal power stations were the mainsource of electricity in France, generating around 120 terawatt hours of power. Nuclear and hydroelectric power stations produced just under75 terawatt hours of electricity each, and renewables provided a negligible amount.
Just one year later, nuclear power overtook thermal poweras the primary source of electricity.
Tips:

3.4 Details 2:
记住一开始的建议,每条线至少写一件事,因此Simon选取了如下四个区域
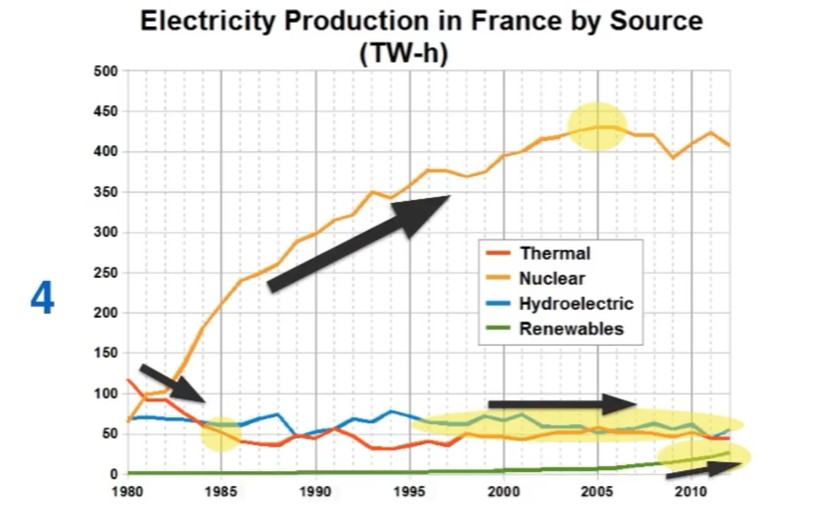
Between 1980 and 2005, electricity production from nuclear power rose dramatically to a peak of 430 terawatt hours.
By contrast, the figure forthermal power fell to only 50 terawatt hours in 1985, and remained at this level for the rest of the period.
Hydroelectric power generation remainedrelatively stable, at between 50 and 80 terawatthours, for the whole 32-year period, but renewable electricity production saw only a small rise toapproximately 25 terawatt hours by 2012.
Simon Lesson 3: 条形图
1、概述:
条形图可以展示一段时间内的数量变化,这种条形图和线图完全一致
但是条形图有时候只展示数量,这种我们就需要新的策略
2、原则:
- 进行总体上的比较(不给出数字):summary/overview paragraphs
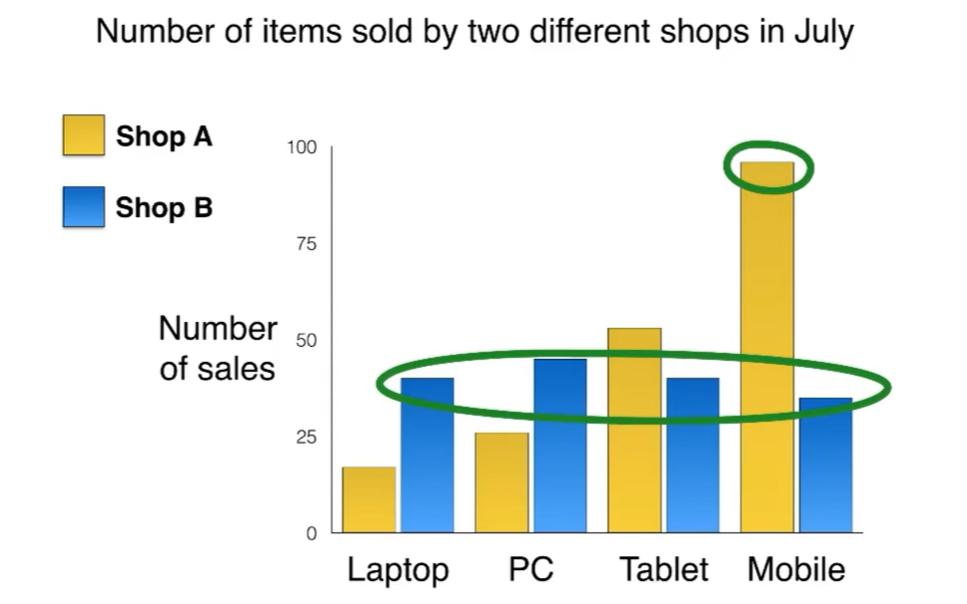
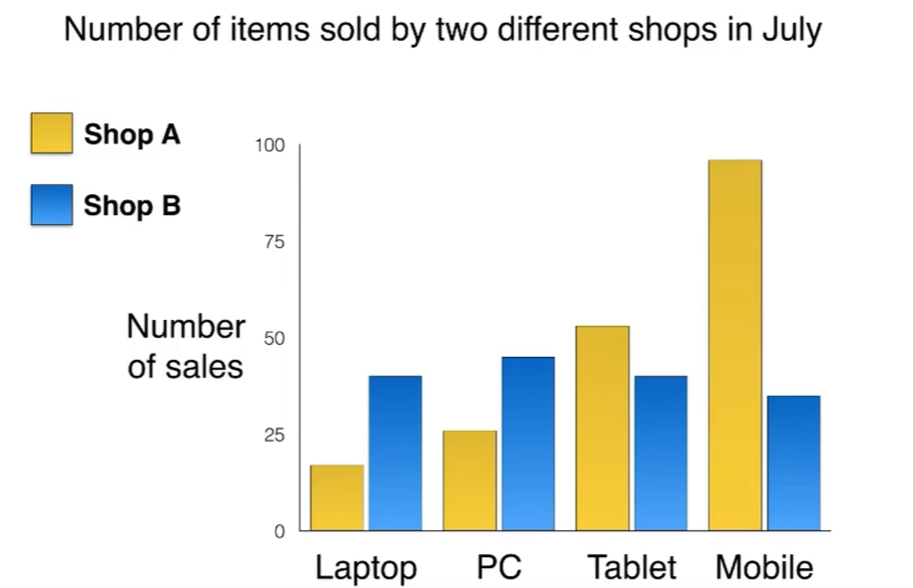
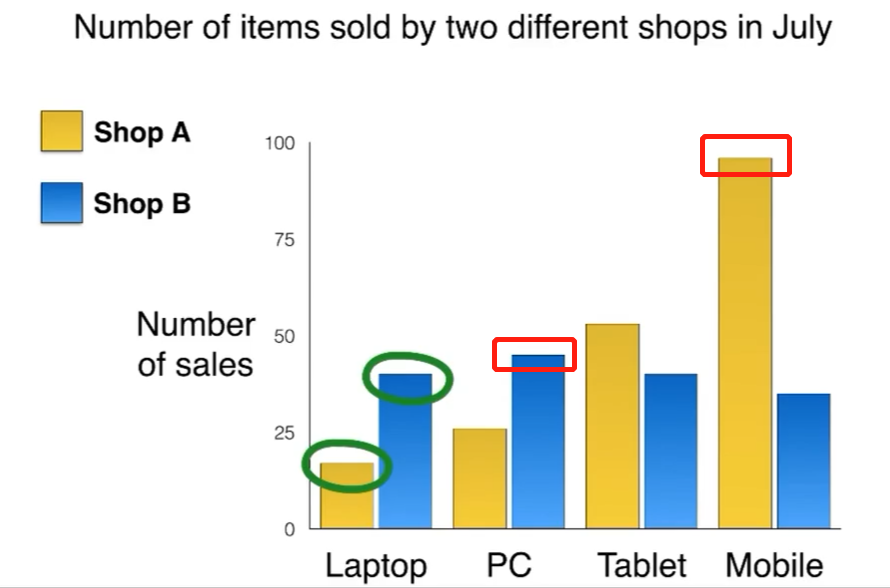
例如对于Shop A,Mobile售卖的数量最多;但是对于Shop B,四种商品售卖的差不多
- 对比特定的数字:details paragraphs
3、Bar chart案例展示:
3.1 Introduction:
3.2 Overview:2句话、2个观点
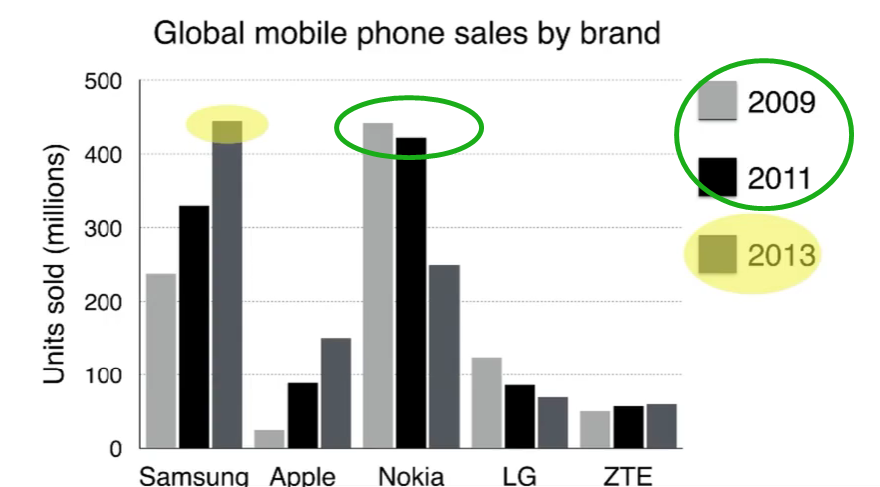
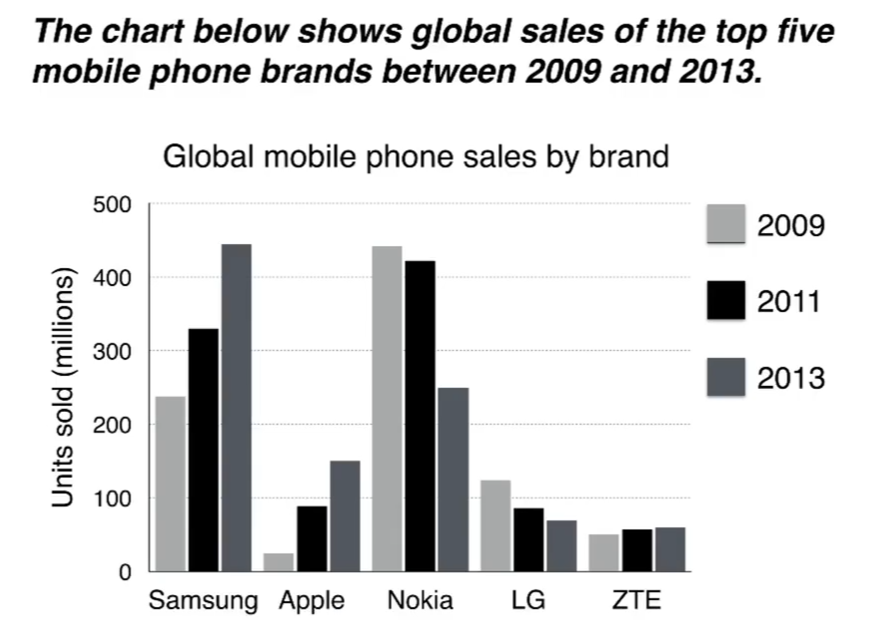
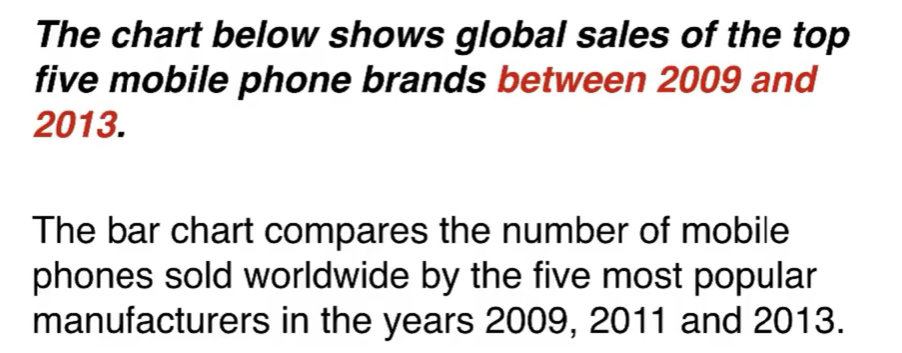
It is clear that Nokia sold the most mobile phones between 2009 and 2011, but Samsung became the best selling brand in 2013. Samsung and Apple saw the biggest rises in sales over the 5-year period.
3.3 Details
Simon在这里计划将Details的两个段按照项的划分进行分类。Details 1计划使用Samsung 和 Nokia,因为这两个品牌在三年中都是销量最高的存在。
- Details 1:对于大部分时间内的对比,变化
![]()

In 2009, Nokia sold close to 450 million mobile phones, which was almost double the number of handsets sold by the second most successful manufacturer, Samsung.
Over the following four years, however, Nokia's sales figures fell by approximately 200 million units, whereas Samsungsaw sales rise by a similar amount. By 2013, Samsung had become the market leader with sales reaching 450 million units.
- Details 2:
![]()

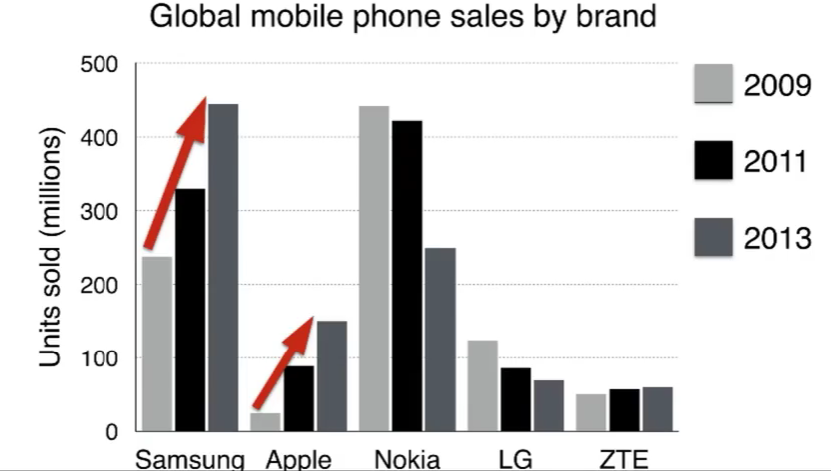
The other three top selling mobile phone brandsbetween 2009 and 2013 were LG, ZTE and Apple.
In 2009, these companies sold around 125 million,50 million and 25 million mobile handsets respectively, but Apple overtook the other two vendors in 2011.
In 2013, purchases of Apple handsets reached 150 million units, while LG saw declining sales and the figures for ZTE rose only slightly.
Simon Lesson 4:饼图
1、概述:
饼图能够展示数字,但是往往展示的都是百分比
饼图能够展示不同时间的变化
饼图还能够展示两个不同事物的对比
2、原则:
- 铭记饼图的总体比例是100%
- 我的任务就是对比百分比或者数字
-
- 进行总体上的比较(不给出数字):summary/overview paragraph
-
- 对比特殊的数字:details paragraphs
3、pie chart案例展示:
3.1 Introduction
3.2 Overview:2句话、2个观点
一个increase,一个decrease是非常相似的,这是一个相似观点

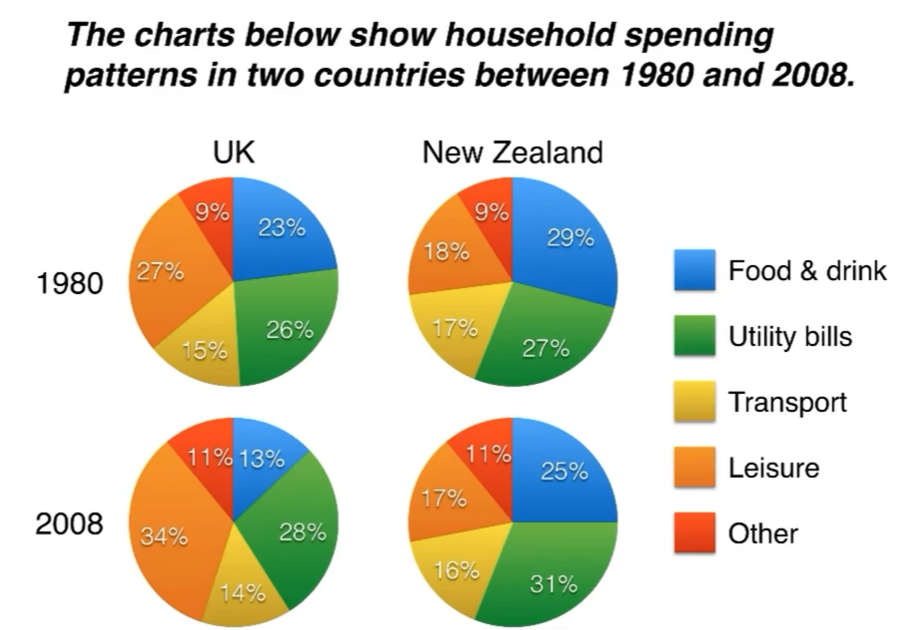
It is noticeable that the proportion of spending on food and drink fell in both countries over the 28-year period, while spending on utility bills rose.
找完相同之后我们找不同,对于Leisure的占比两个国家有着明显的区别
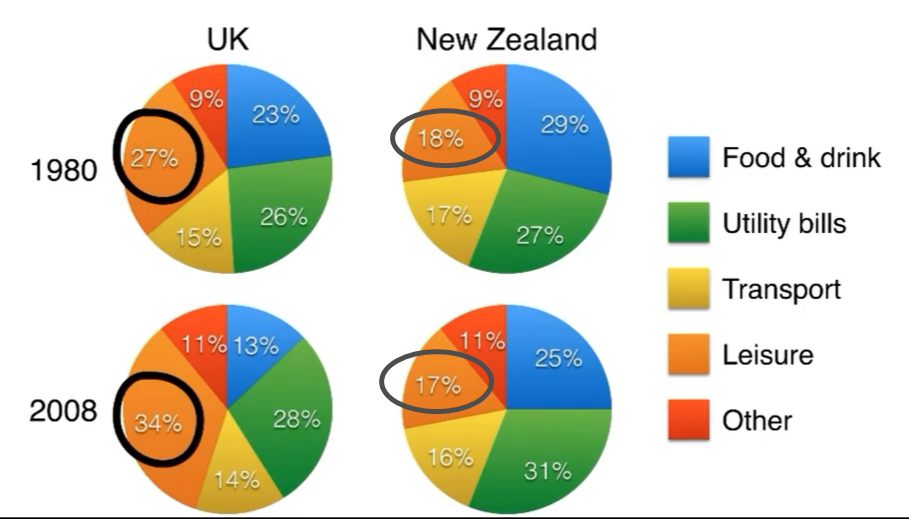
Also, UK residents spent a significantly larger percentage of their household budgets on leisure than their New Zealand counterparts
3.3 Details 1
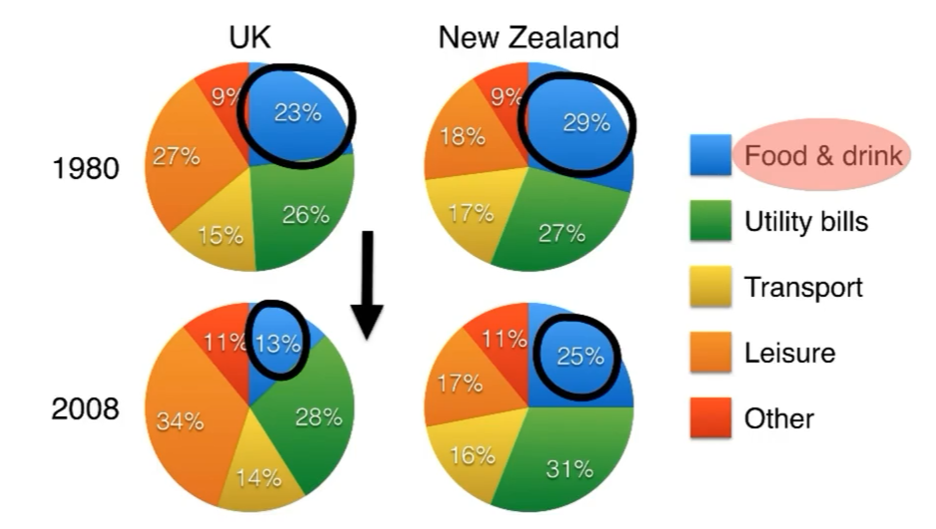
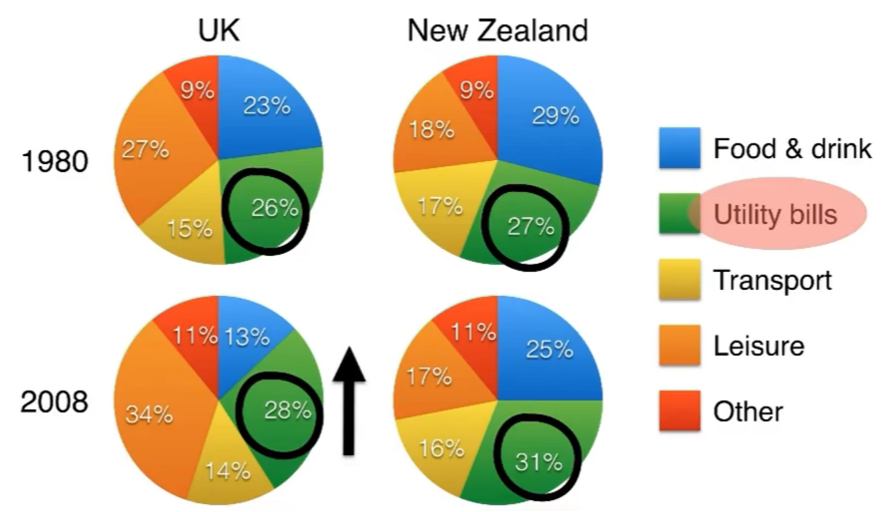
In 1980, 29% of an average New Zealand household budget went on food and drink, while the equivalent figure for a UK home was 23%. By 2008, expenditure on food and drink had fallen by 4% in New Zealand, and by a full 10% in the Uk.By contrast, both countries saw an increase in expenditure on utility bills for the average homefrom 27% to 31% in New Zealand and from 26% to 28% in the UK.
3.4 Details 2
这里会提及到overview中并没有涉及到的东西:Transport and Other
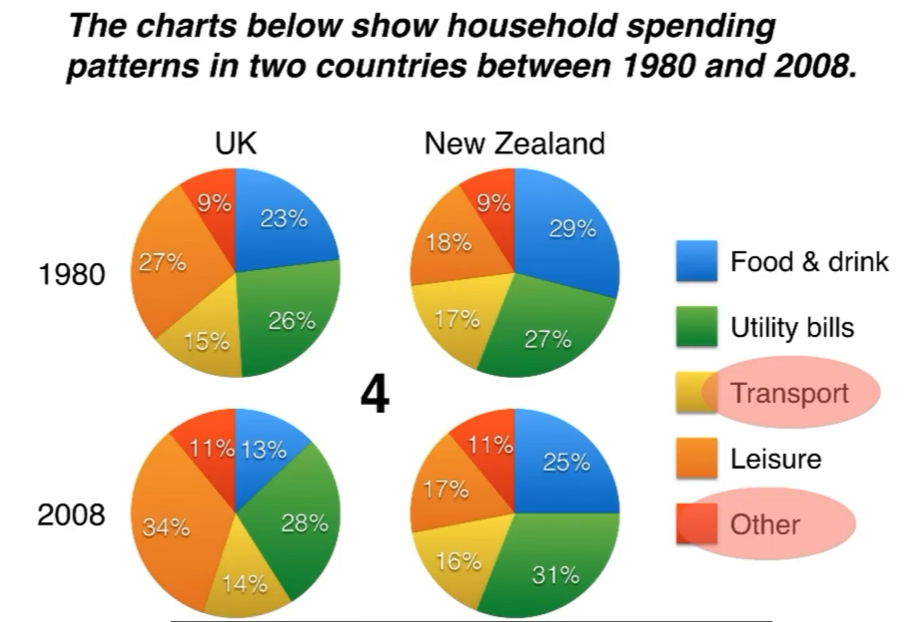
Leisure activities accounted for the highest proportion of UK household spending in both years, but only the third highest proportion in New Zealand.In fact,in 2008, New Zealanders spent only half as much in relative terms on recreation(17%) as UK residents (34%).In both countries, transport costs and other costs took roughly 15% and 10% of household budgets respectively.
Simon Lesson 5:表格
1、概述
表格能够展示:
- 任何形式的数字
- 能够表现出线图、条形图和饼图同样的信息
- 对比
- 时间变化的改变
- 其他很多信息
2、原则
表格能够展示的信息过多,因此我们应该选择、描述并比对关键数字,缩小范围
- 寻找主要或总体的特征:summary/overview paragraph
- 描述具体数字:details paragraphs
3、Table案例展示:

3.1 Introduction
3.2 Overview:2句话、2个观点
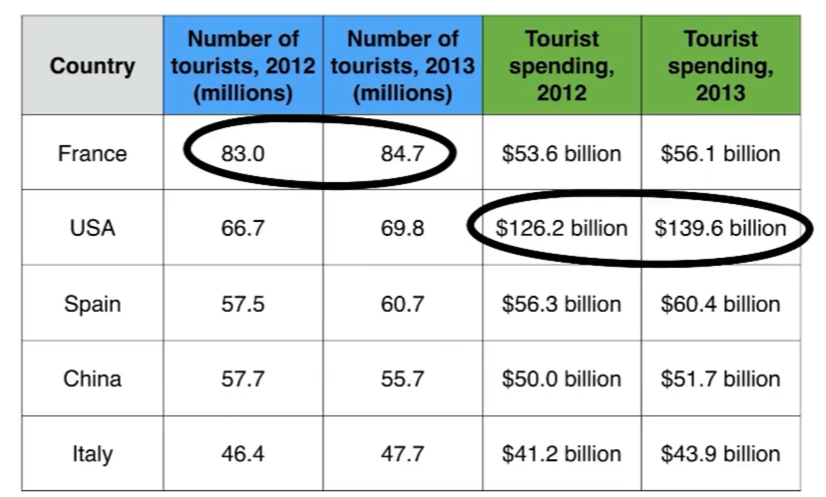
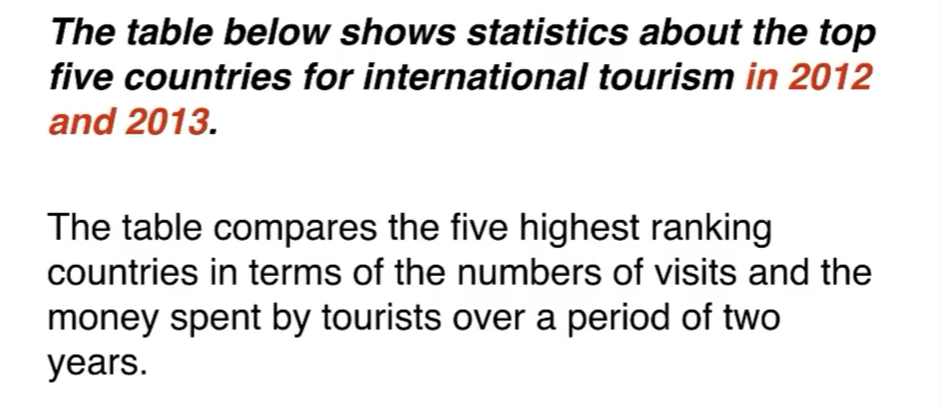
It is clear that France was the world's most popular tourist destination in the years 2012 and 2013.However, the USA earned by far the most revenue from tourism over the same period.
3.3 Details 1:聚焦在tourists visited
两个年份,五个国家

In 2012, 83 million tourists visited France, and the USA was the second most visited country, with 66.7 million tourists.Spain and China each received just under 58 million visitors, while ltaly was ranked fifth with 46.4 million tourists. 2013 saw a rise of between 1 and 4 million tourist visits to each country, with the exception of China, which received 2 million fewer visitors than in the previous year.
3.4 Details 2:

Spending by tourists visiting the USA increased from $126.2 billion in 2012 to $139.6 billion in 2013, and these figures were well over twice as high as those for any other country. Spain received the second highest amounts of tourist revenue, rising from $56.3 billion to $60.4 billion, followed by France, China and ltaly. Interestingly, despite falling numbers of tourists, Chinese revenue from tourism rose by $1.7 billion in 2013.
Simon Lesson 6:Different charts
1、概述
由于我们面对的不再是相同的图表,因此我们的任务是选取、描述和比较两张表中的关键数字。
但是我们并不需要两张表放在一起对比,可以分开进行描述。
2、原则
- 寻找一个关键的特征在每张图表中:summary paragraph
- 分别描述每张图表:details paragraphs
3、2-chart question
3.1 Introduction
3.2 Overview:2句话、2个观点
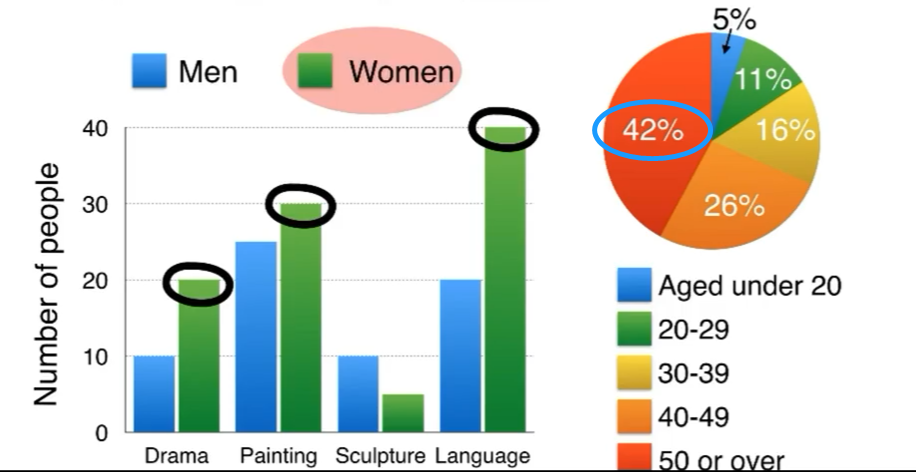
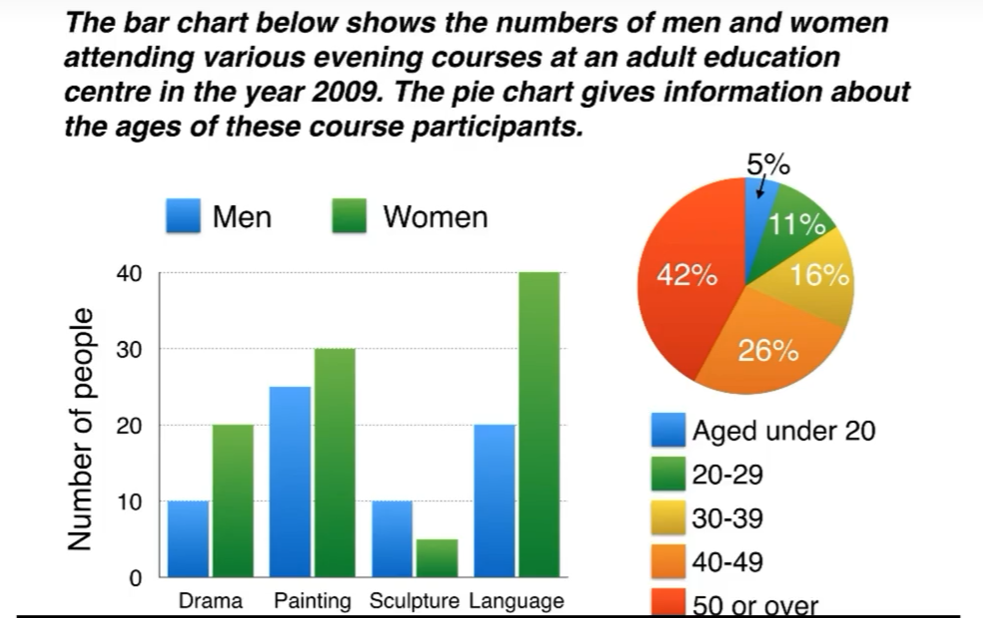
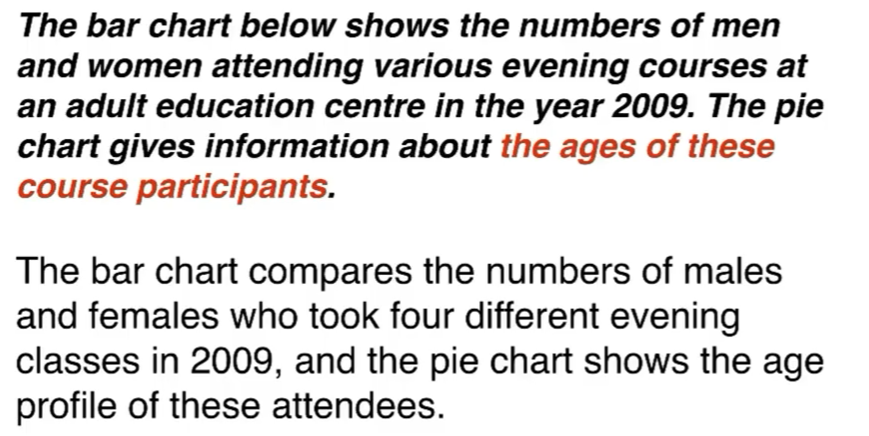
It is clear that significantly more women than men attended evening classes at the education centre.We can also see that evening courses were much more popular among older adults.
3.3 Details 1
According to the bar chart, drama, painting and language courses all attracted more women than men to the education centre in 2009. Language classes had the highest number of participants overall, with 40 female and 20 male students, while painting was a popular choice among both genders, attracting 30 female and 25 male attendees.The only course with a higher number of males was sculpture, but this course was taken by a mere 15 people in total.
3.4 Details 2
Looking at the age profile pie chart, we can see that the majority of people attending evening lessons were over 40 years of age. To be precise 42% of them were aged 50 or more, and 26% were aged between 40 and 49. Younger adults were in the minority, with only 11% of students aged 20 to29, and only 5% aged under 20
Simon Lesson 7:流程图
1、概述
雅思流程图大致可以分为两种,需要注意地图也是流程图的一种
-
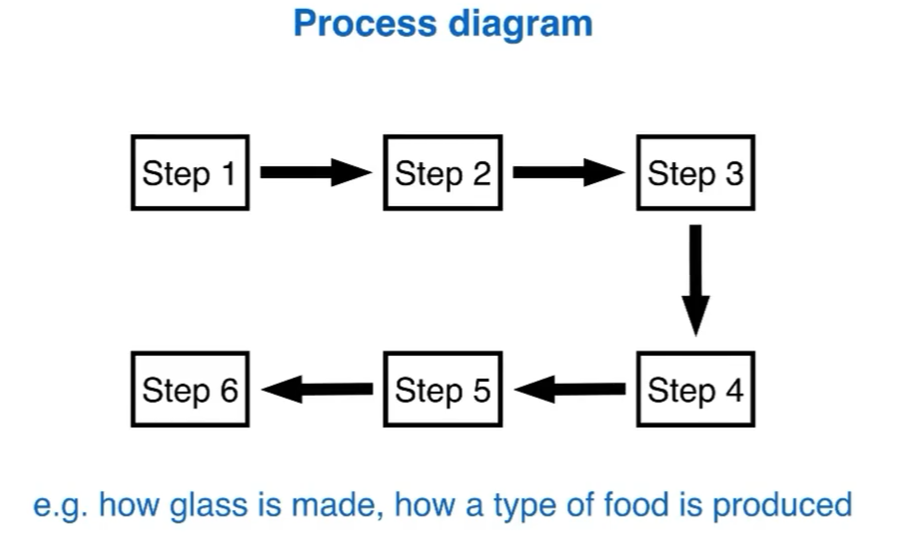
一种是没有闭环的,一般都是人的生产过程
![]()
-
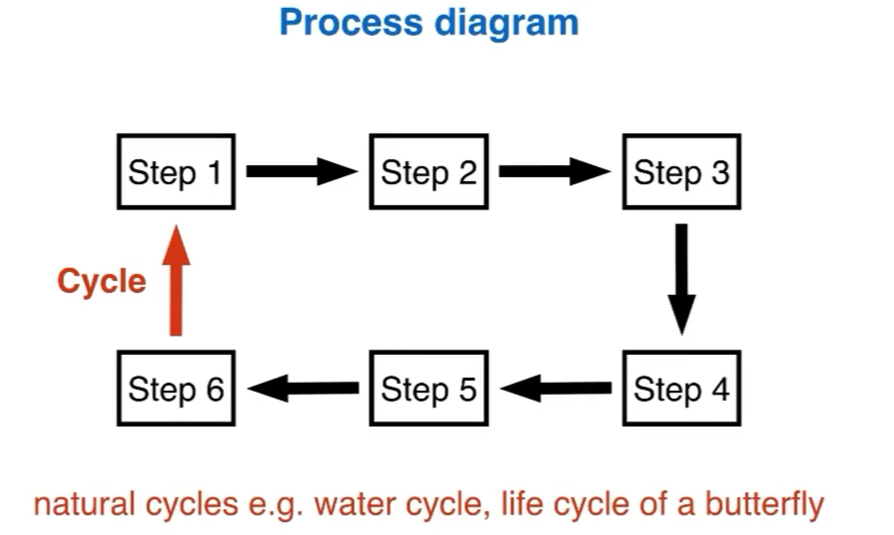
另一种是闭环的,一般是指自然界中的循环
![]()
2、要点
描述流程图和之前学到的图表写作方式完全不同
- 没有数字
- 不能比较任何事情
- 不能够描述趋势
因此我们要做的事情变成了
- 多少个步骤
- 哪里开始和结束
- 详细描述每一步
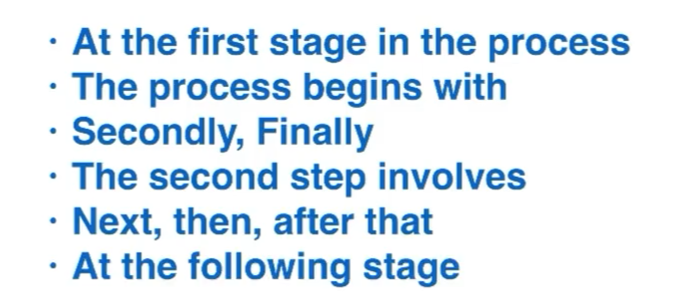
而对于步骤的描述语言
-
steps language
![]()
-
passive verbs:被动语句
![]()
![]()

如果我们并不知道一个词的过去分词,我们可以换一种表达方式


3、Process diagram案例展示:
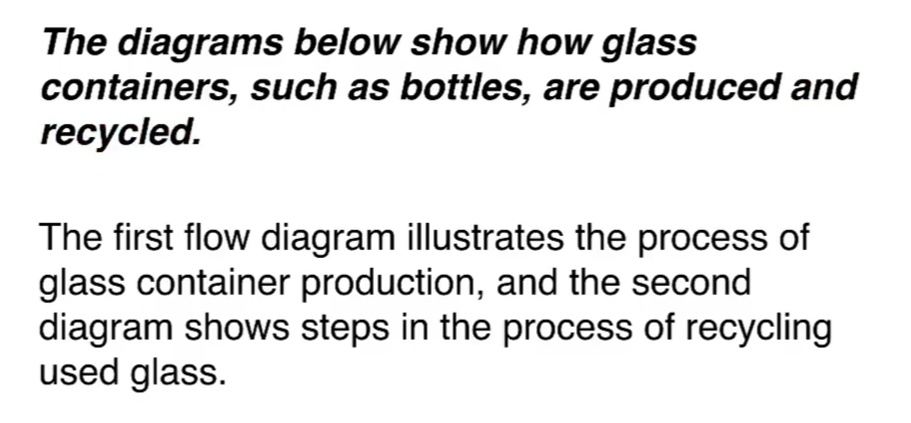
3.1 Introduction
3.2 Overview:2句话、2个观点
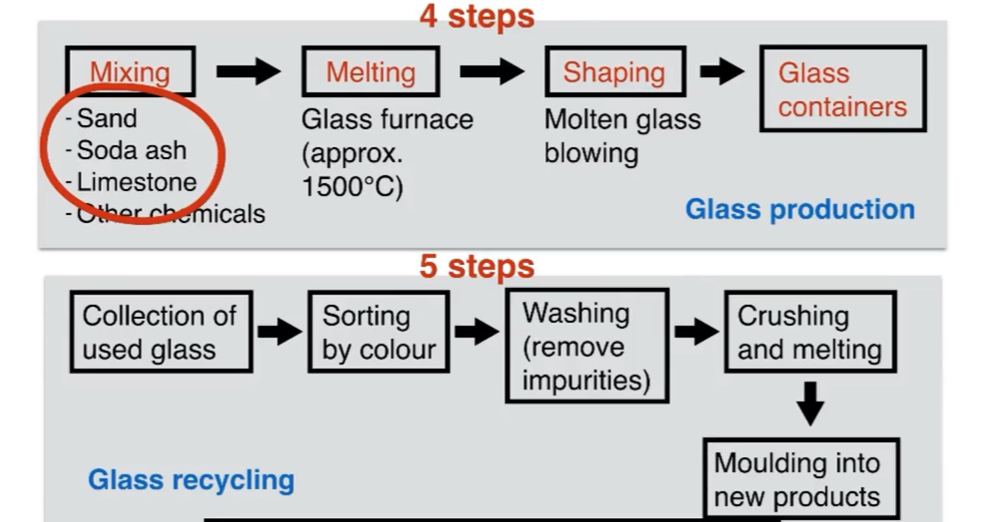
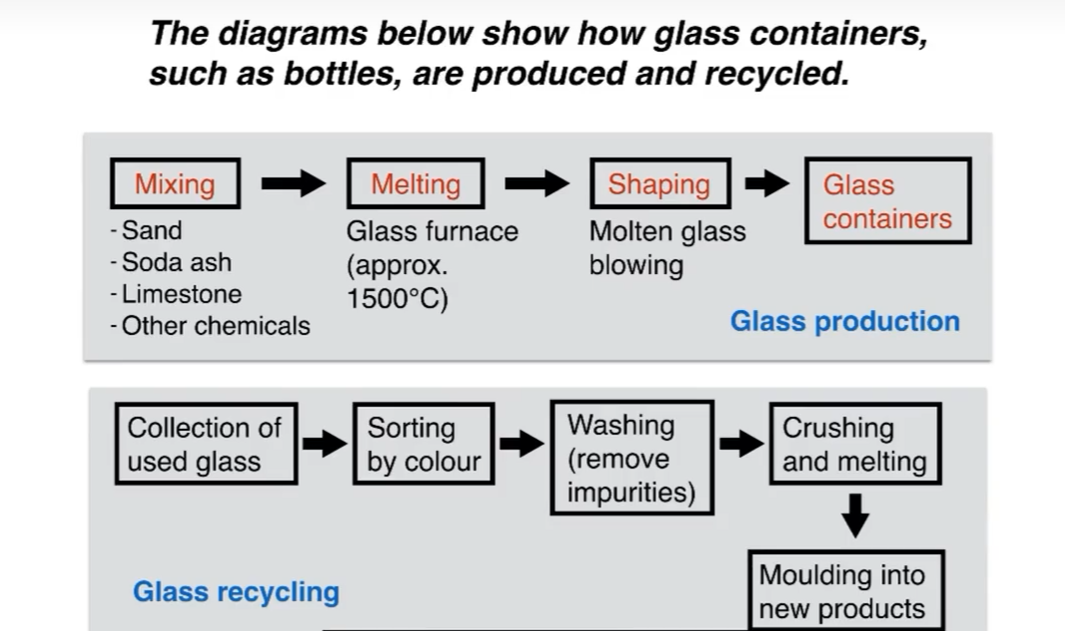
We can see that glass is made using three main raw materials, and that the manufacturing process consists of four distinct stages. lt requires five steps to turn used glass into new glass products.
3.3 Details 1
At the first stage in the production of glass, sand, soda ash,limestone and other chemicals are mixed together. Next, this mixture is heated in a glass furnace at approximately 1500C to produce molten glass. The molten glass can then be shaped, by blowing, to create the end products, namely glass containers.
3.4 Details 2
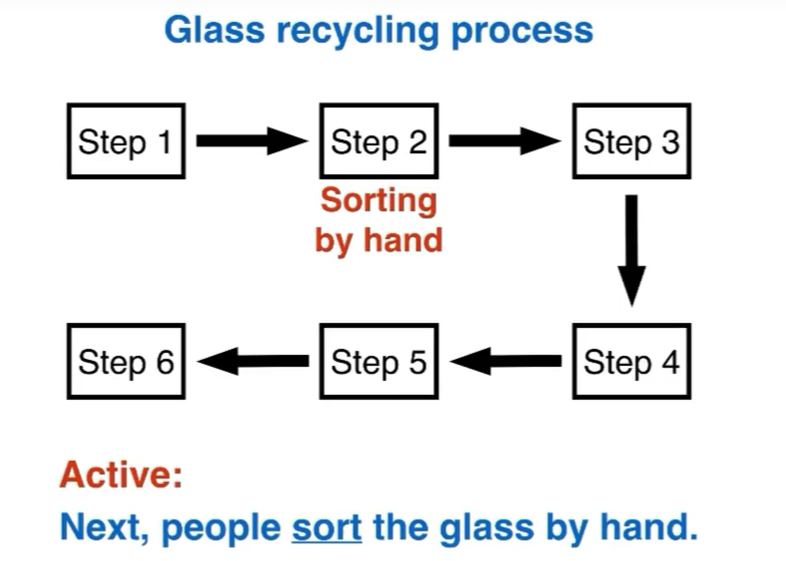
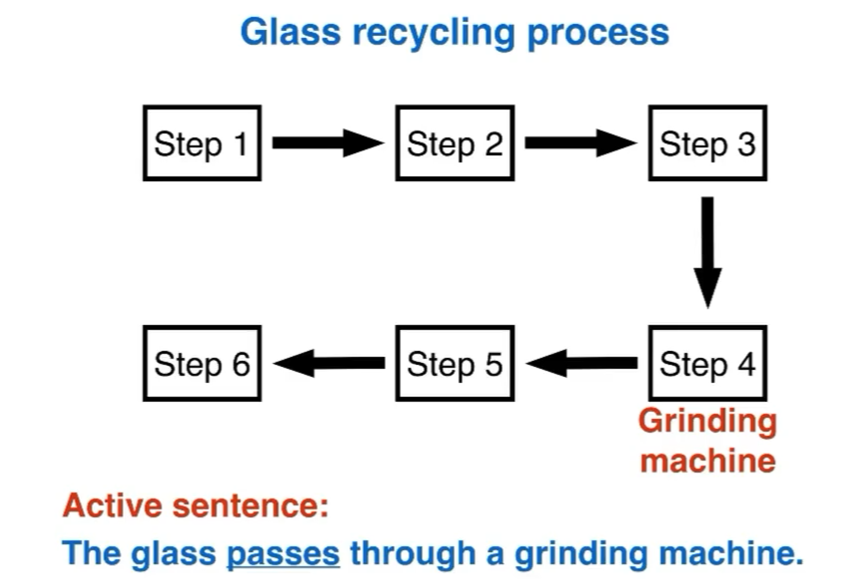
Glass recycling begins with the collection of used glass products. The collected glass is sorted according to its colour, and then washed in order to remove any impurities. At the fourth stage of recycling, the glass is crushed and melted, and there sulting molten glass can finally be moulded to create new items.
Simon Lesson 8:对比图
1、概述:
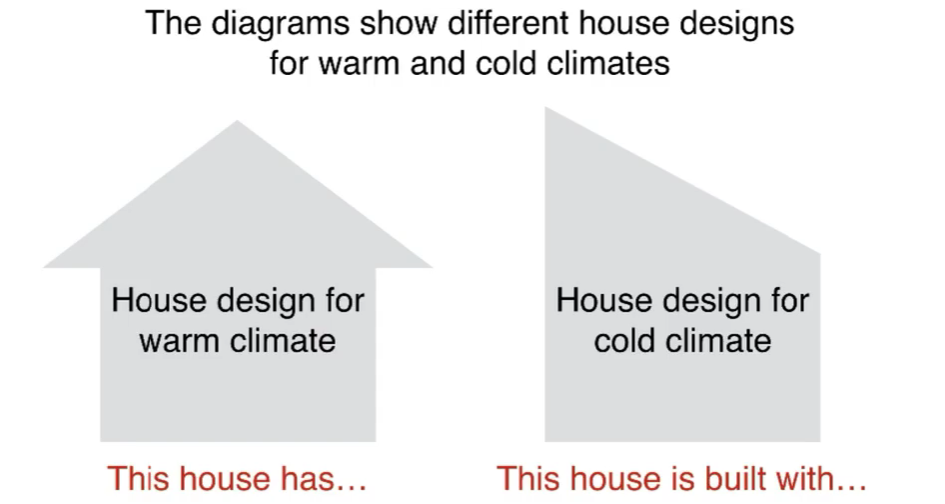
对比图会有三种类型
-
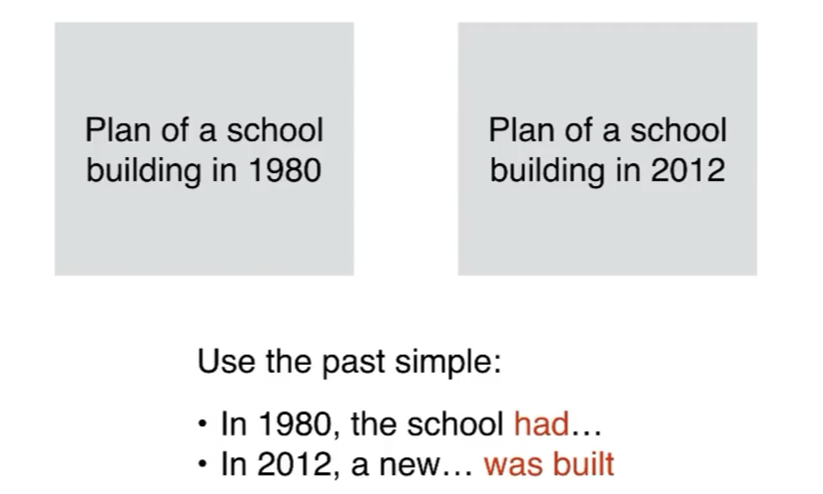
新旧设计的比较:前后图
![]()
![]()
-
两个可选的设计
![]()
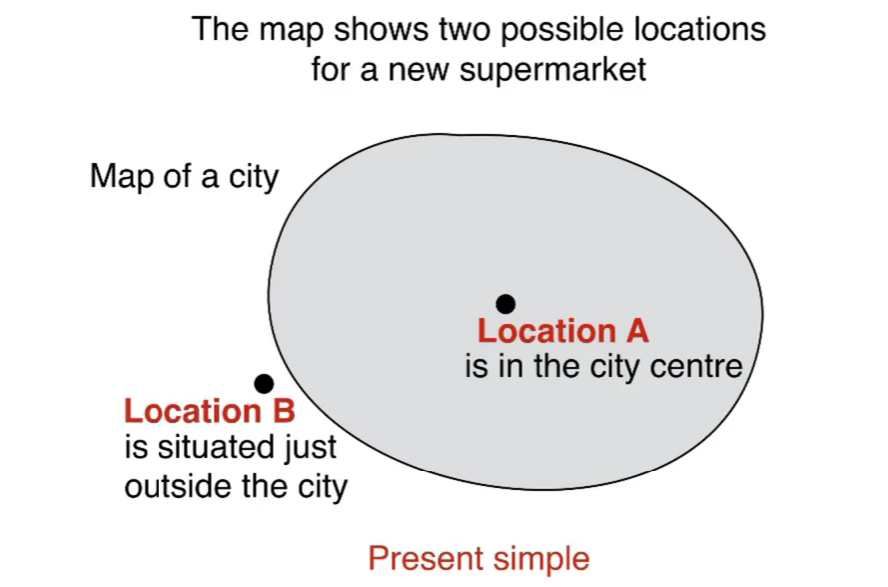
-
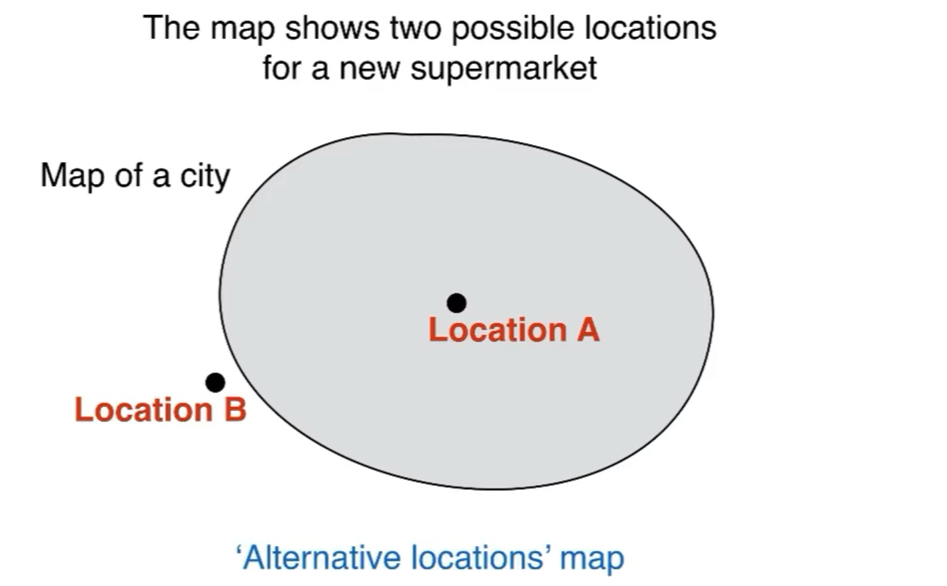
地图上两个可选的位置
![]()
2、要点:
对比两个图的要点
- 描述改变(前后图)
- 描述没有改变的事情
- 描述差异
- 描述相似点
使用的语句要点
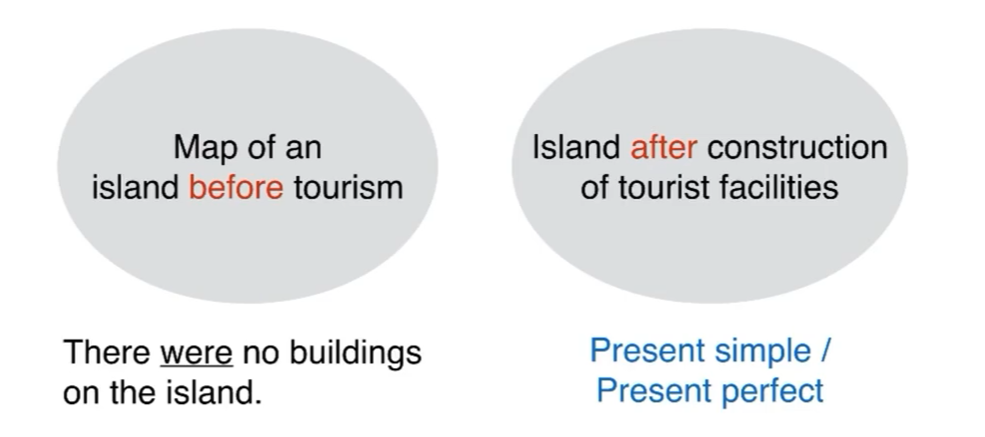
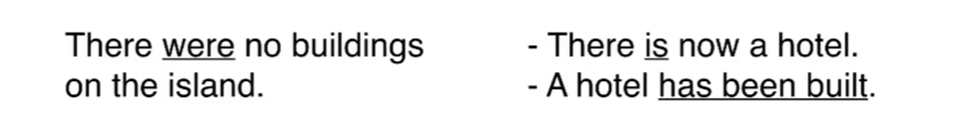
- 考虑使用的动词时态

3、Comparison diagram案例展示:
3.1 Introduction
3.2 Overview:2句话、2个观点
simon选择了一个改变的和一个未改变的作为两个观点
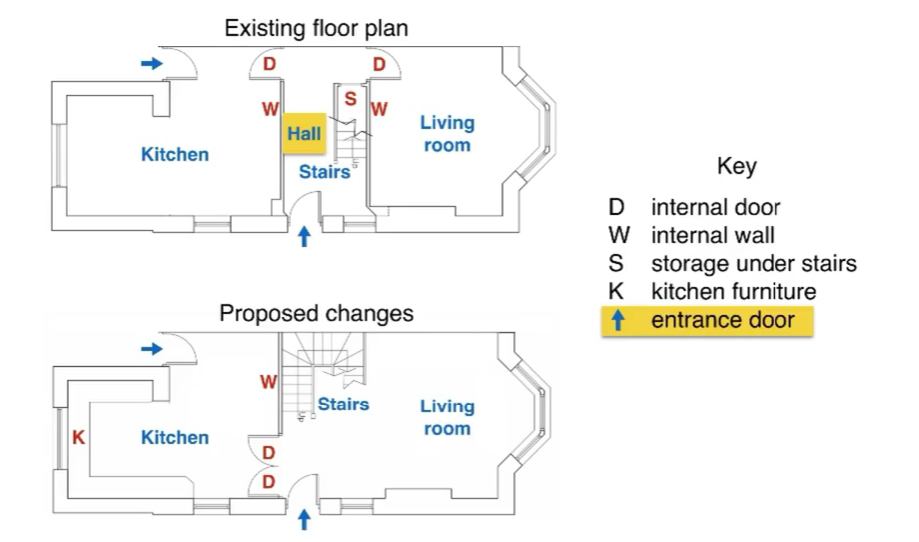
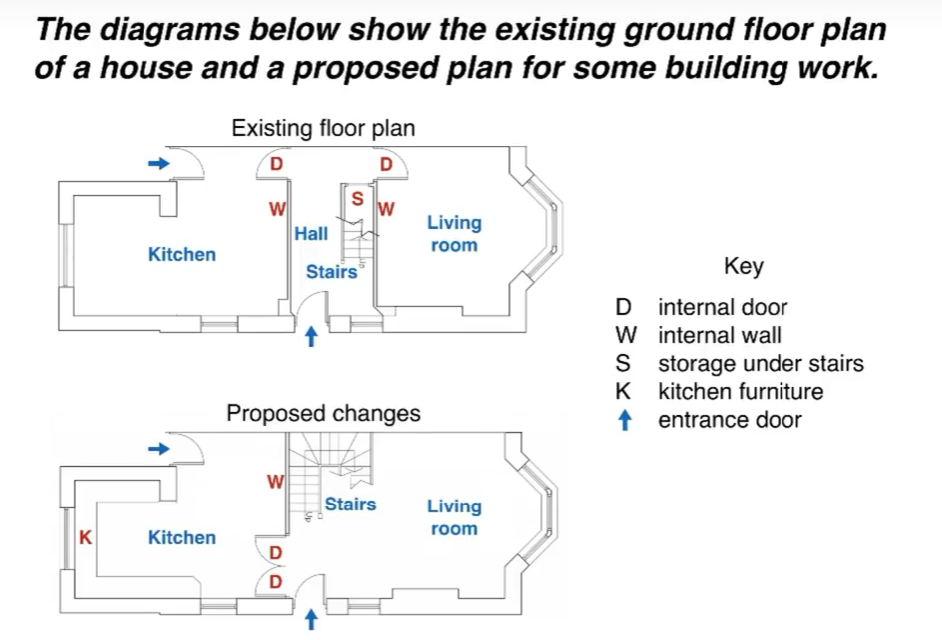
We can see that the new design proposa involves making a number of changes to the ground floor of the house, mainly in the central hall area.There are no plans to change externa walls or entrances
3.3 Details 1:compare
Simon说分开两张图单独描述分数并不会很高,他的方式是先对比一部分内容,下一段再对比剩下的
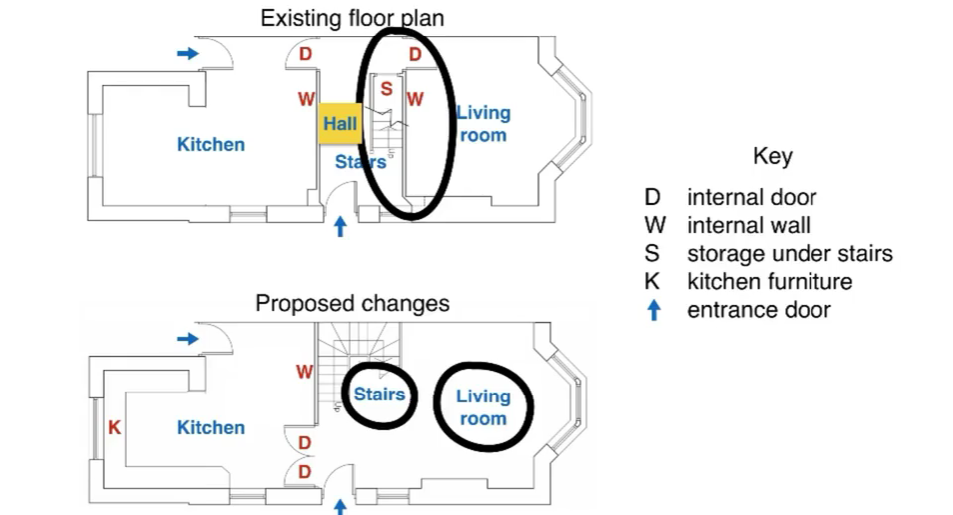
The most noticeable change from the existing to the proposed floor plan is that there will no longer be a separate hall area when the building work has been done. This will be achieved by removing the internal wall and door between the hall and living room, along with the current staircase and understair storage cupboard. With no separate hall area the proposed living room will also contain the staircase to the first floor.
3.4 Details 2
To replace the current straight staircase, a new set of winding stairs will be installed in the corner of the living room. The internal door between the hall and kitchen will also be replaced with double doors connecting the kitchen with the new living room.Finally, the planned building work will also include the installation of some kitchen furniture.

 浙公网安备 33010602011771号