WIndows下使用Grafana+InfluxDB打造监控系统
前言
对于一个运维DBA来说,了解数据库的TPS、QPS很有必要(QPS:每秒查询数,即对数据库每秒的DML的操作数;TPS:每秒事物处理,即对数据库每秒DDL操作数),通过了解他们,可以掌握一个实例的基本工作运行状态。此外,还有系统地运行与性能信息,如CPU和内存配置信息等等。目前对这些数据进行可视化的方法有很多,其中一种就是本文将要介绍的通过时序数据库(influxdb)+grafana+python脚本+......来构建监控系统。
注:本文监控的数据不仅限于TPS、QPS、CPU等。下面开始搭建环境,记录实践过程!
1. 安装Grafana
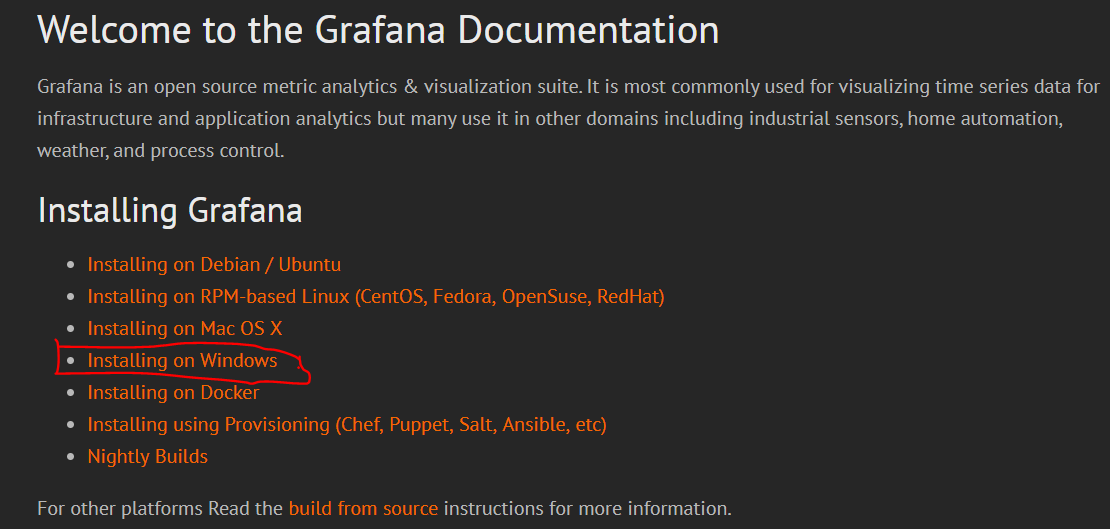
进入Grafana Documentation Home,按照文档说明进行安装:
The Grafana backend includes Sqlite3 which requires GCC to compile. So in order to compile Grafana on Windows you need to install GCC. We recommend TDM-GCC.
Copy conf/sample.ini to a file named conf/custom.ini and change the web server port to something like 8080. The default Grafana port, 3000, requires special privileges on Windows.
(本文配置的端口是8082)
--Run Grafana as windows service
Start Grafana by executing grafana-server.exe, preferably from the command line. If you want to run Grafana as windows service, download NSSM. It is very easy add Grafana as a Windows service using that tool.
2. 安装InfluxDB
influxdb是目前比较流行的时间序列数据库。
- 何谓时间序列数据库?
什么是时间序列数据库,最简单的定义就是数据格式里包含Timestamp字段的数据,比如某一时间环境的温度,CPU的使用率等。但是,有什么数据不包含Timestamp呢?几乎所有的数据其实都可以打上一个Timestamp字段。时间序列数据的更重要的一个属性是如何去查询它,包括数据的过滤,计算等等。
而且它是一个开源的分布式时序、时间和指标数据库,使用go语言编写,无需外部依赖。其具有三大特性:
- 时序性(Time Series):与时间相关的函数的灵活使用(诸如最大、最小、求和等);
- 度量(Metrics):对实时大量数据进行计算;
- 事件(Event):支持任意的事件数据,换句话说,任意事件的数据我们都可以做操作。
可在如下地址下载InfluxDB的各种版本:https://portal.influxdata.com/downloads#influxdb
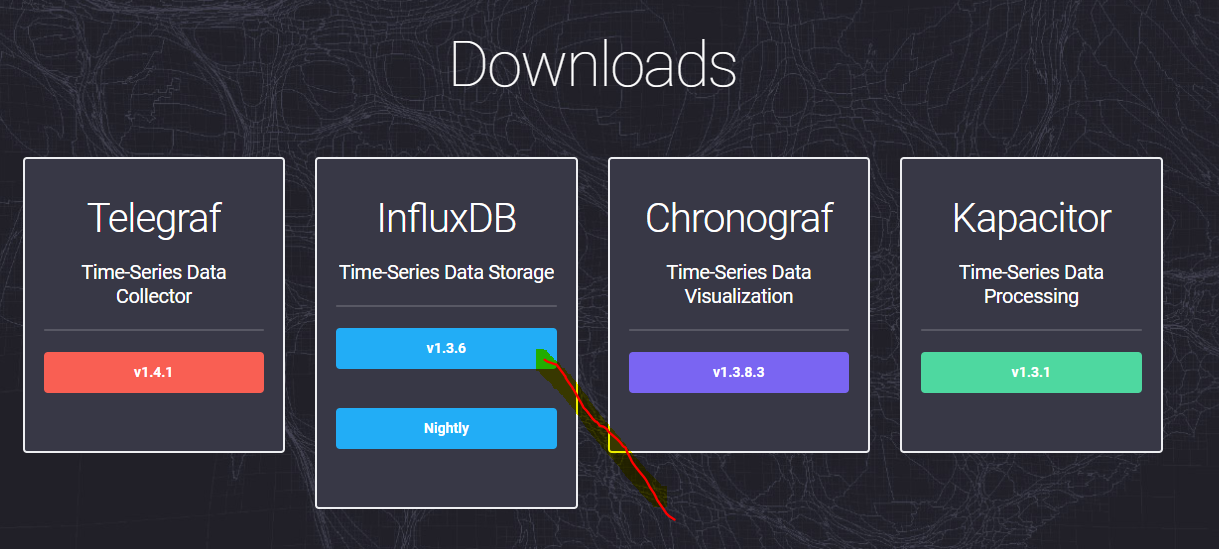

根据需要选择相应的版本下载,在这里我们选择windows binaries 版本下载,直接将下载地址复制到浏览器中即可下载。
https://dl.influxdata.com/influxdb/releases/influxdb-1.3.6_windows_amd64.zip--安装和配置
InfluxDB并不需要安装,只需要解压到相应的目录即可,主要就是一个配置文件和几个可执行文件。
一开始,我直接下载的最新的influxdb-1.3.6发现里面的文件格式不对,经过研究我又下载了influxdb-1.3.5版本,发现格式正常而且也有配置文件。


不过,如果没有配置文件,可以通过如下方式生成(For create influxdb configuration file we can also use the below command):
influxd config > influxdb.conf
有很多人在安装运行InfluxDB后去访问8083端口的web管理页面却发现无法正常打开,主要问题是web管理界面默认是关闭的,我们需要将其打开后再访问页面使用。
修改配置文件influxdb.conf,将admin配置一段修改为如下:
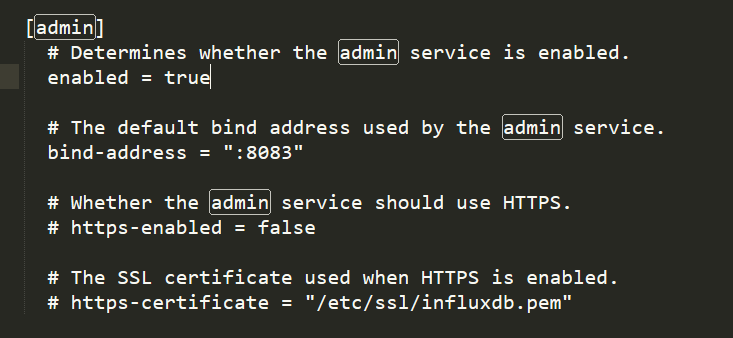
另外,因为是该配置文件主要还是适应于linux系统地,有些文件路径需要酌情更改。
--运行
运行的方式大致有两种:
- shift+右键安装目录打开命令行窗口(直接到达指定目录,比打开cmd,一步步指定目录要方便),键入如下命令开启InfluxDB服务:
influxd -config influxdb.conf - 正如官网所述
查看控制台的输出:
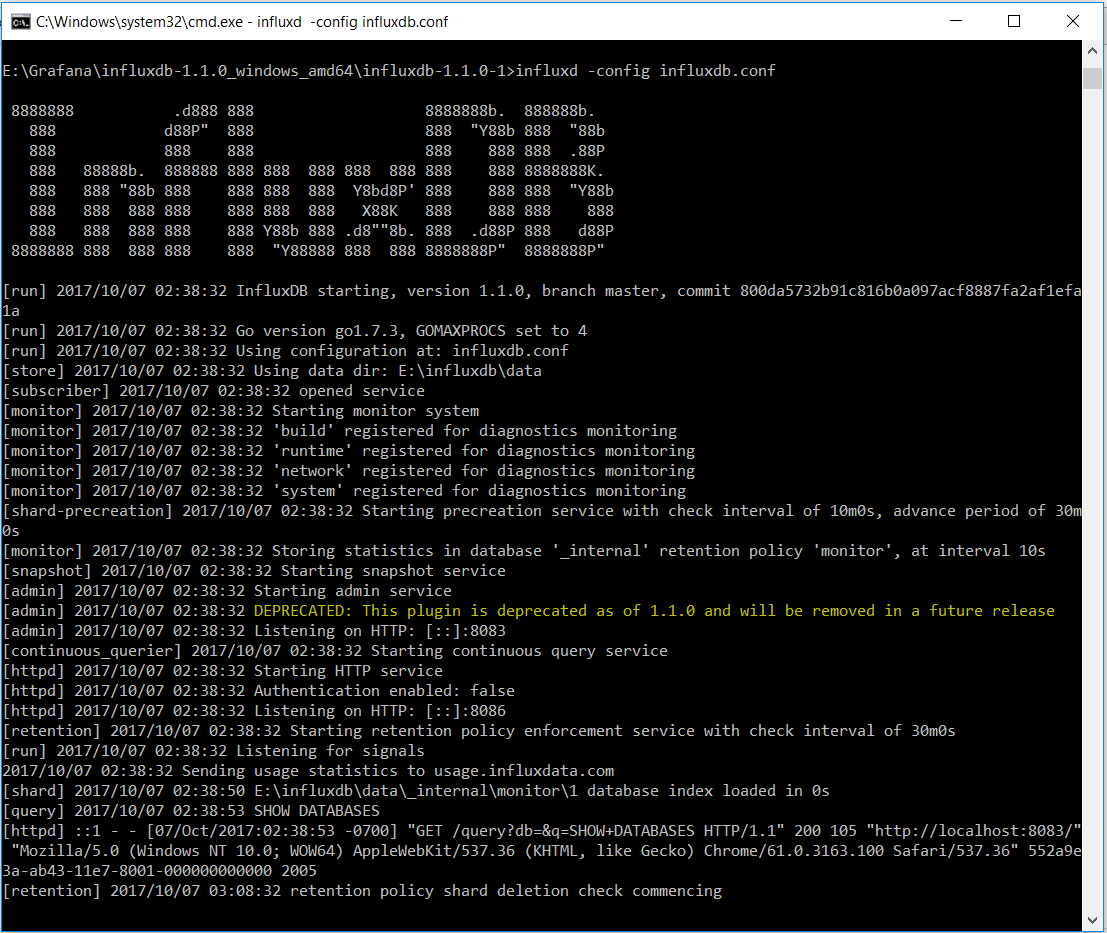
这里使用的版本为1.10,黄色标记部分提示在未来更高版本中admin部分的配置将会移除掉,这就为上面高版本的配置文件的内容作了解释。
待InfluxDB启动完成后,试试web管理界面是不是可以使用了(http://localhost:8083/)?

设置连接信息:

3. 创建数据
https://docs.influxdata.com/influxdb/v1.1/introduction/getting_started/
4. 配置Grafana
当有了数据源后 , 就可以开始配置grafana来展示数据了
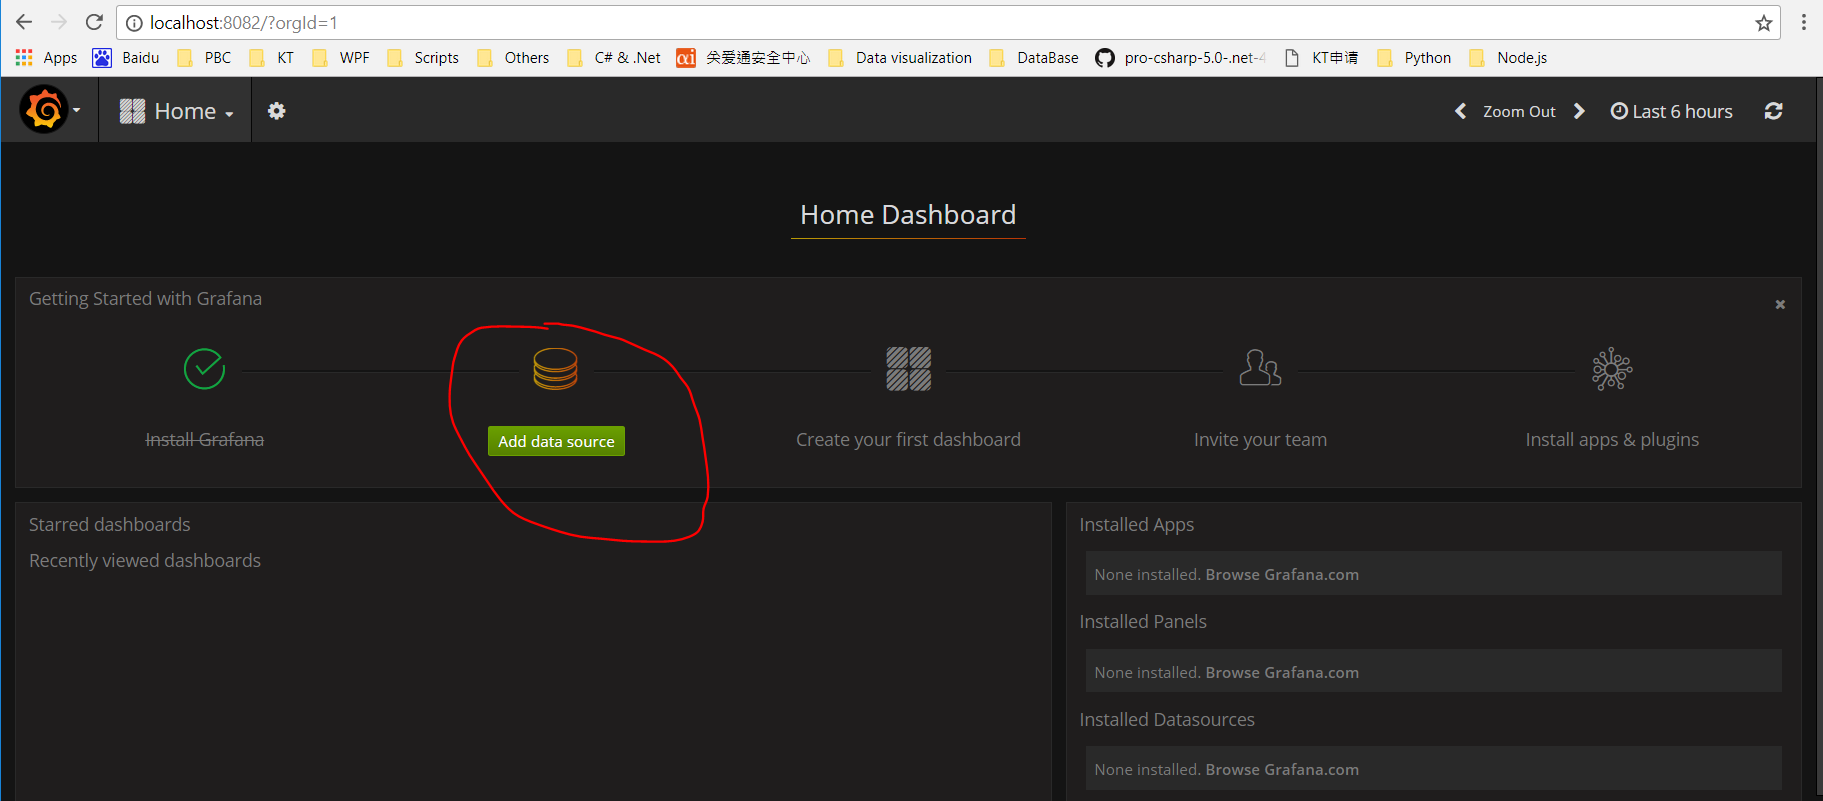
1).登陆grafana , 新建数据源 , 并配置好相关信息

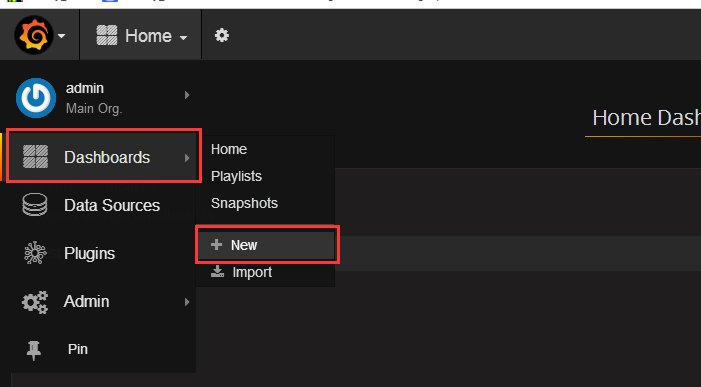
2).添加Dashboards
5. 不同版本的client for InfluxDB
5.1 使用python安装influxdb-python
获取资源:https://github.com/influxdb/influxdb-python.git


安装完成显示没有发现requirements.txt,不知有何影响?
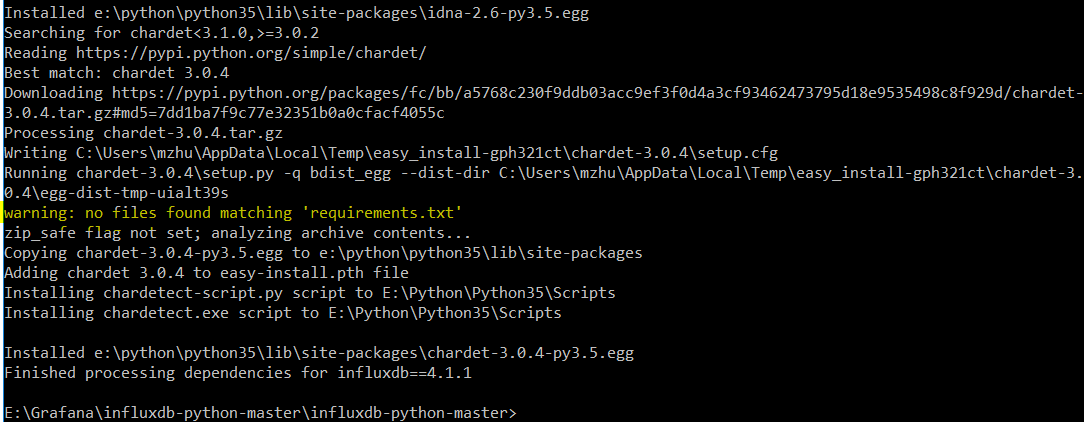
打开python输入
from influxdb import client as influxdb
如果没有错误信息,则表示安装成功。

接下来就可以使用python操作InfluxDB啦:
(1)数据表操作示例如下:
#! /usr/bin/env python
#-*- coding:utf-8 -*-

from influxdb import InfluxDBClient

json_body = [
    {
        "measurement": "students",
        "tags": {
            "stuid": "s123"
        },
        #"time": "2017-03-12T22:00:00Z",
        "fields": {
            "score": 89
        }
    }
]

def showDBNames(client):
        result = client.query('show measurements;') # 显示数据库中的表
        print("Result: {0}".format(result))

client = InfluxDBClient('localhost', 8086, 'root', '', 'testdb') # 初始化(指定要操作的数据库)
showDBNames(client)
client.write_points(json_body) # 写入数据,同时创建表
showDBNames(client)
client.query("drop measurement students") # 删除表
showDBNames(client)
5.2 .NET环境安装InfluxDB.Client.Net
It's a C# client object model to help integrate with InfluxDB.(https://github.com/AdysTech/InfluxDB.Client.Net)
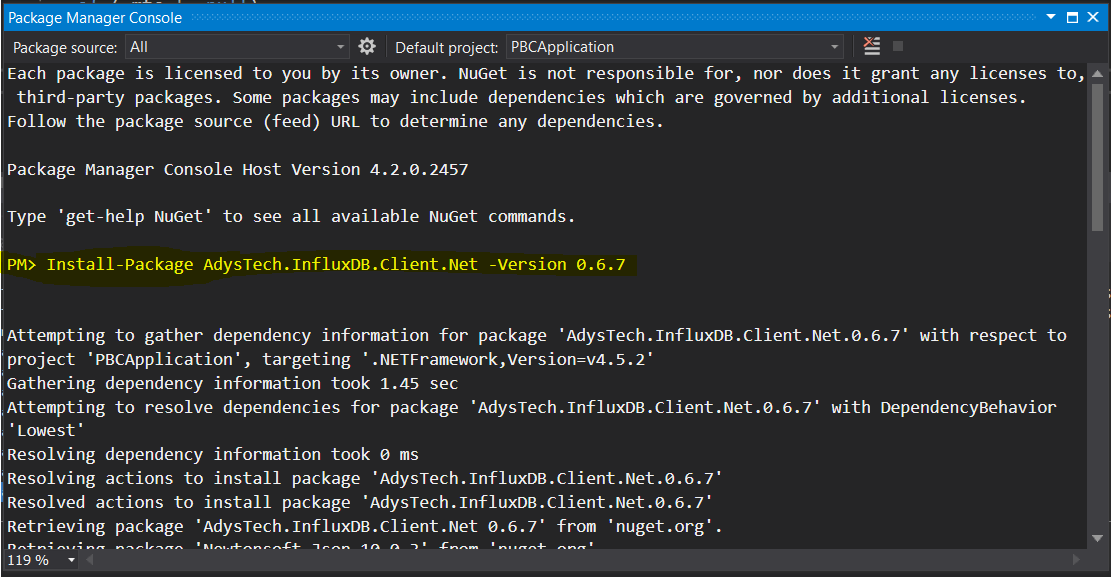
安装方式见:https://www.nuget.org/packages/AdysTech.InfluxDB.Client.Net/0.6.7

We use the NuGet Package Manager Console to install NuGet packages.
Open the console in Visual Studio using the Tools > NuGet Package Manager > Package Manager Console command.
参考文章:


