【今日分享】The Correct Way to Measure Inference Time of Deep Neural Networks

Background
The network latency is one of the more crucial aspects of deploying a deep network into a production environment. Most real-world applications require blazingly fast inference time, varying anywhere from a few milliseconds to one second. But to correctly measure inference time or latency of a neural network requires profound understanding. Even experienced programmers often make common mistakes that lead to inaccurate latency measurements. The impact of these mistakes has the potential to trigger bad decisions and unnecessary expenditures.
In this post, we review some of the main issues that should be addressed to measure inference time or latency correctly. We review the main processes that make GPU execution unique, including asynchronous execution and GPU warm up. We then share code samples to measure inference time correctly on a GPU. Finally, we review some of the common mistakes people make when quantifying inference time on GPUs.
Asynchronous execution
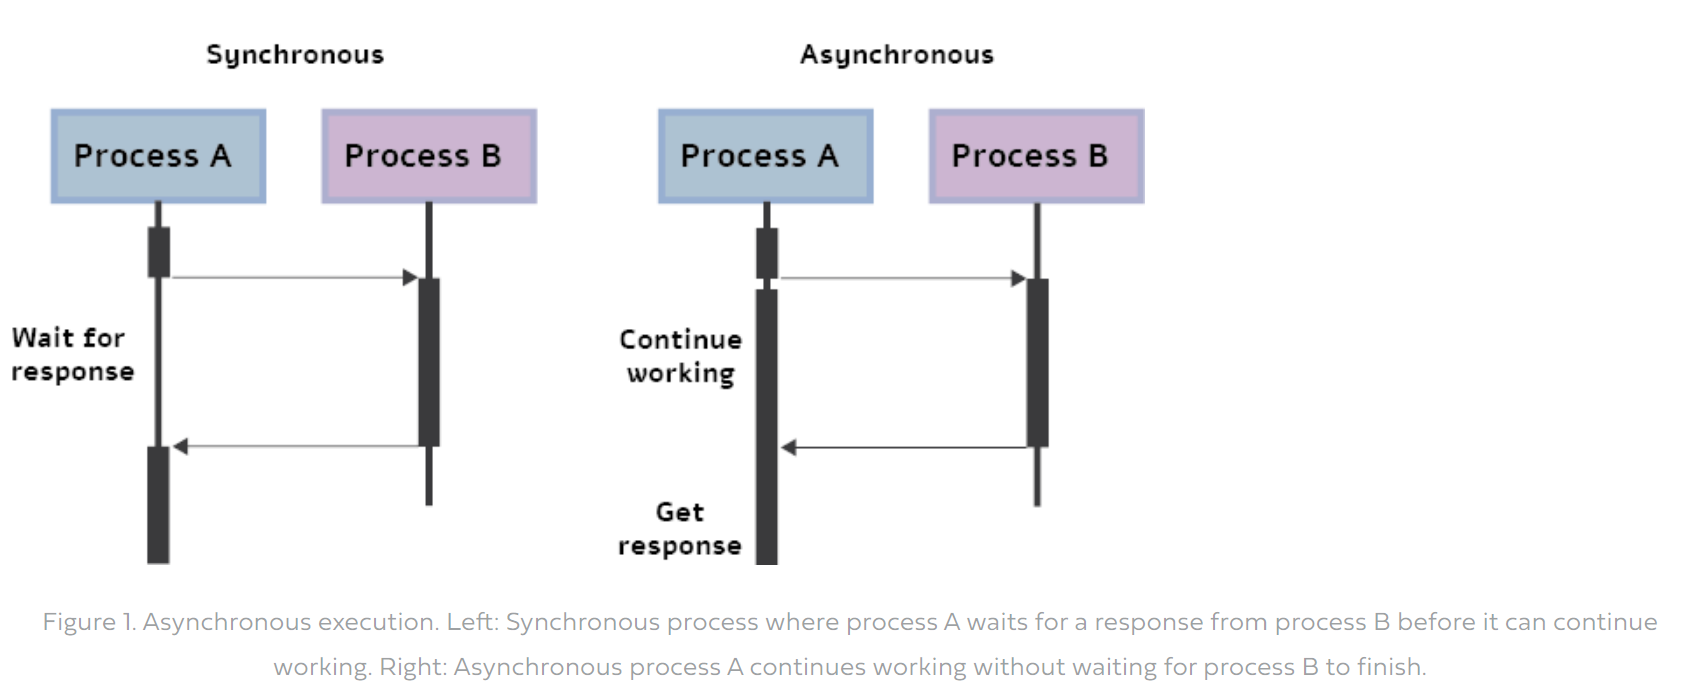
We begin by discussing the GPU execution mechanism. In multithreaded or multi-device programming, two blocks of code that are independent can be executed in parallel; this means that the second block may be executed before the first is finished. This process is referred to as asynchronous execution. In the deep learning context, we often use this execution because the GPU operations are asynchronous by default. More specifically, when calling a function using a GPU, the operations are enqueued to the specific device, but not necessarily to other devices. This allows us to execute computations in parallel on the CPU or another GPU.

Asynchronous execution offers huge advantages for deep learning, such as the ability to decrease run-time by a large factor. For example, at the inference of multiple batches, the second batch can be preprocessed on the CPU while the first batch is fed forward through the network on the GPU. Clearly, it would be beneficial to use asynchronism whenever possible at inference time.
The effect of asynchronous execution is invisible to the user; but, when it comes to time measurements, it can be the cause of many headaches. When you calculate time with the “time” library in Python, the measurements are performed on the CPU device. Due to the asynchronous nature of the GPU, the line of code that stops the timing will be executed before the GPU process finishes. As a result, the timing will be inaccurate or irrelevant to the actual inference time. Keeping in mind that we want to use asynchronism, later in this post we explain how to correctly measure time despite the asynchronous processes.
GPU warm-up
A modern GPU device can exist in one of several different power states. When the GPU is not being used for any purpose and persistence mode (i.e., which keeps the GPU on) is not enabled, the GPU will automatically reduce its power state to a very low level, sometimes even a complete shutdown. In lower power state, the GPU shuts down different pieces of hardware, including memory subsystems, internal subsystems, or even compute cores and caches.
The invocation of any program that attempts to interact with the GPU will cause the driver to load and/or initialize the GPU. This driver load behavior is noteworthy. Applications that trigger GPU initialization can incur up to 3 seconds of latency, due to the scrubbing behavior of the error correcting code. For instance, if we measure time for a network that takes 10 milliseconds for one example, running over 1000 examples may result in most of our running time being wasted on initializing the GPU. Naturally, we don’t want to measure such side effects because the timing is not accurate. Nor does it reflect a production environment where usually the GPU is already initialized or working in persistence mode.
Since, we want to enable the GPU power-saving mode whenever possible, let’s look at how to overcome the initialization of the GPU while measuring time.
The correct way to measure inference time
The PyTorch code snippet below shows how to measure time correctly. Here we use Efficient-net-b0 but you can use any other network. In the code, we deal with the two caveats described above. Before we make any time measurements, we run some dummy examples through the network to do a ‘GPU warm-up.’ This will automatically initialize the GPU and prevent it from going into power-saving mode when we measure time. Next, we use tr.cuda.event to measure time on the GPU. It is crucial here to use torch.cuda.synchronize(). This line of code performs synchronization between the host and device (i.e., GPU and CPU), so the time recording takes place only after the process running on the GPU is finished. This overcomes the issue of unsynchronized execution.
model = EfficientNet.from_pretrained('efficientnet-b0')
device = torch.device("cuda")
model.to(device)
dummy_input = torch.randn(1, 3,224,224, dtype=torch.float).to(device)

# INIT LOGGERS
starter, ender = torch.cuda.Event(enable_timing=True), torch.cuda.Event(enable_timing=True)
repetitions = 300
timings=np.zeros((repetitions,1))
#GPU-WARM-UP
for _ in range(10):
    _ = model(dummy_input)
# MEASURE PERFORMANCE
with torch.no_grad():
    for rep in range(repetitions):
        starter.record()
        _ = model(dummy_input)
        ender.record()
        # WAIT FOR GPU SYNC
        torch.cuda.synchronize()
        curr_time = starter.elapsed_time(ender)
        timings[rep] = curr_time

mean_syn = np.sum(timings) / repetitions
std_syn = np.std(timings)
print(mean_syn)
Common mistakes when measuring time
When we measure the latency of a network, our goal is to measure only the feed-forward of the network, not more and not less. Often, even experts will make certain common mistakes in their measurements. Here are some of them, along with their consequences:
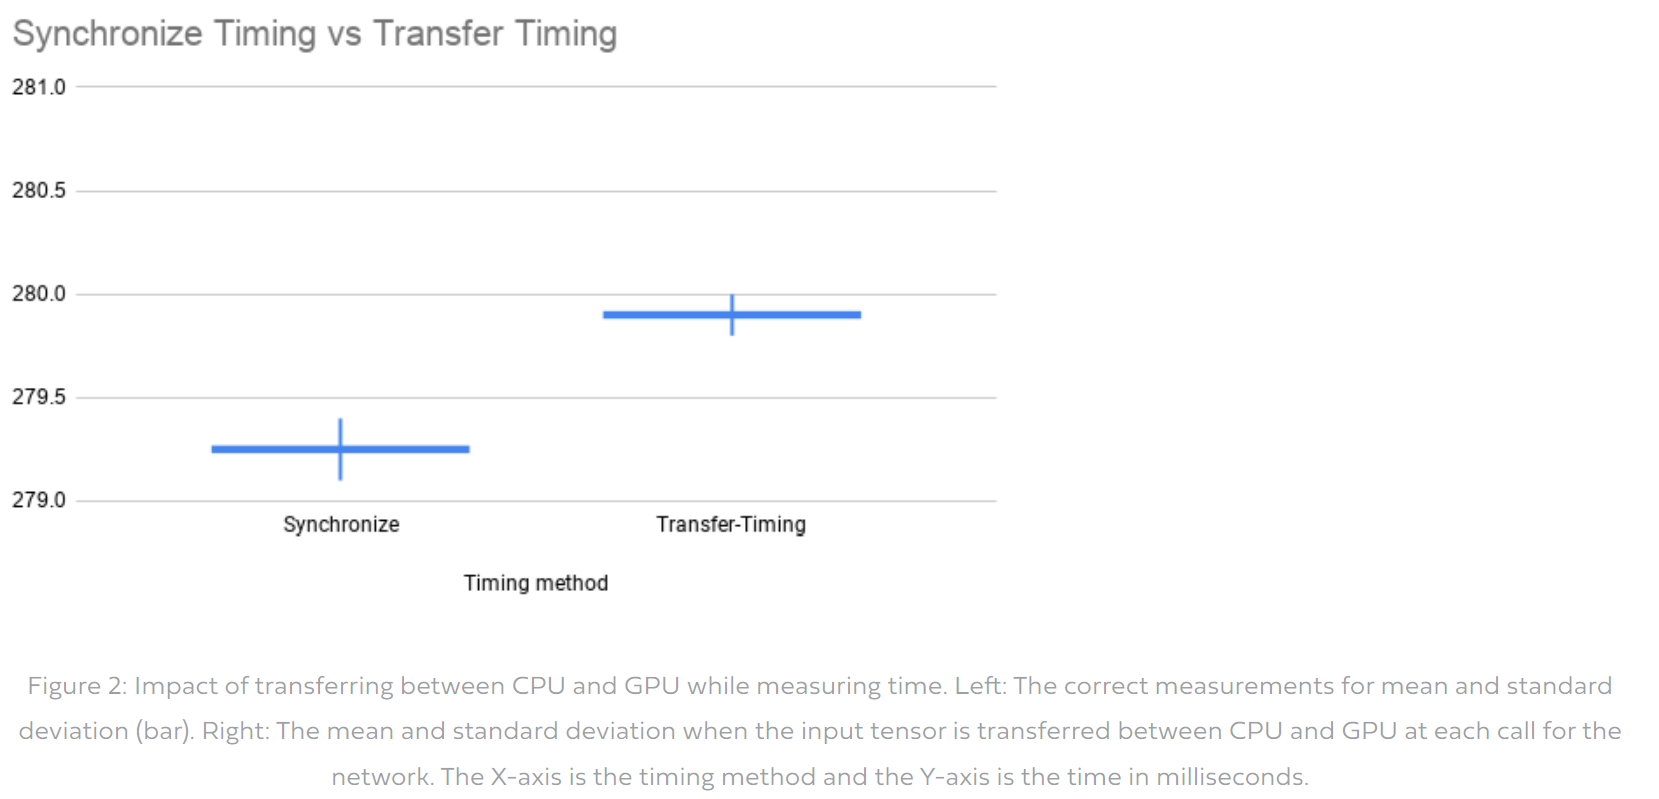
1. Transferring data between the host and the device. The point of view of this post is to measure only the inference time of a neural network. Under this point of view, one of the most common mistakes involves the transfer of data between the CPU and GPU while taking time measurements. This is usually done unintentionally when a tensor is created on the CPU and inference is then performed on the GPU. This memory allocation takes a considerable amount of time, which subsequently enlarges the time for inference. The effect of this mistake over the mean and variance of the measurements can be seen below:

2. Not using GPU warm-up. As mentioned above, the first run on the GPU prompts its initialization. GPU initialization can take up to 3 seconds, which makes a huge difference when the timing is in terms of milliseconds.
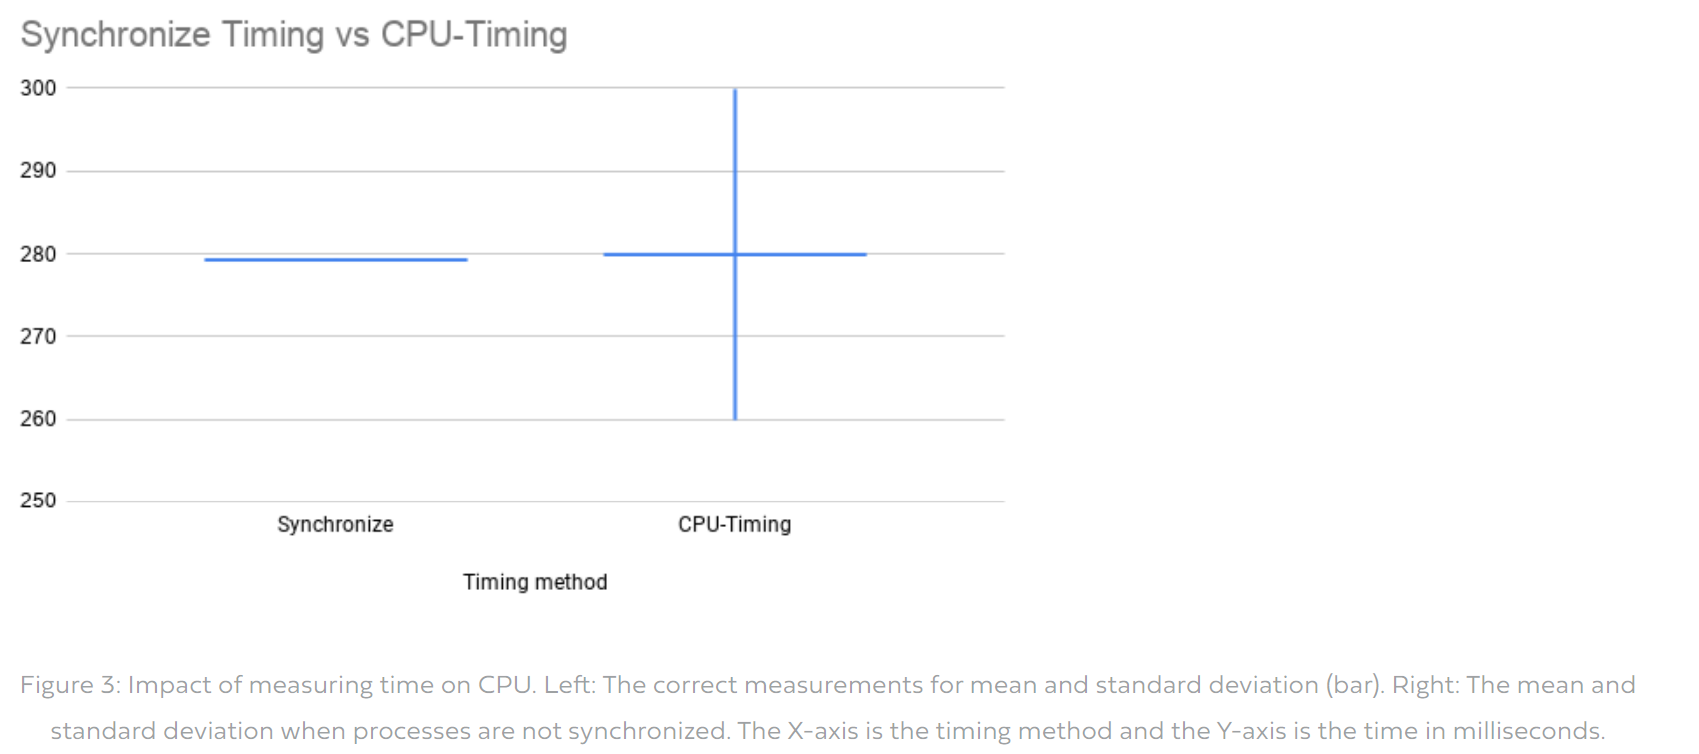
3. Using standard CPU timing. The most common mistake made is to measure inference time without synchronization. Even experienced programmers have been known to use the following piece of code.
 s = time.time()
 _ = model(dummy_input)
curr_time = (time.time()-s )*1000
This of course completely ignores the asynchronous execution mentioned earlier and hence outputs incorrect times. The impact of this mistake on the mean and variance of the measurements are shown below:

4. Taking one sample. Like many processes in computer science, feed forward of the neural network has a (small) stochastic component. The variance of the run-time can be significant, especially when measuring a low latency network. To this end, it is essential to run the network over several examples and then average the results (300 examples can be a good number). A common mistake is to use one sample and refer to it as the run-time. This, of course, won’t represent the true run-time.
Measuring Throughput
The throughput of a neural network is defined as the maximal number of input instances the network can process in time a unit (e.g., a second). Unlike latency, which involves the processing of a single instance, to achieve maximal throughput we would like to process in parallel as many instances as possible. The effective parallelism is obviously data-, model-, and device-dependent. Thus, to correctly measure throughput we perform the following two steps: (1) we estimate the optimal batch size that allows for maximum parallelism; and (2), given this optimal batch size, we measure the number of instances the network can process in one second.
To find the optimal batch size, a good rule of thumb is to reach the memory limit of our GPU for the given data type. This size of course depends on the hardware type and the size of the network. The quickest way to find this maximal batch size is by performing a binary search. When time is of no concern a simple sequential search is sufficient. To this end, using a for loop we increase by one the batch size until Run Time error is achieved, this identifies the largest batch size the GPU can process, for our neural network model and the input data it processes.
After finding the optimal batch size, we calculate the actual throughput. To this end, we would like to process many batches (100 batches will be a sufficient number) and then use the following formula:
(number of batches X batch size)/(total time in seconds)
This formula gives the number of examples our network can process in one second. The code below provides a simple way to perform the above calculation (given the optimal batch size):
model = EfficientNet.from_pretrained('efficientnet-b0')
device = torch.device("cuda")
model.to(device)
dummy_input = torch.randn(optimal_batch_size, 3,224,224, dtype=torch.float).to(device)

repetitions=100
total_time = 0
with torch.no_grad():
    for rep in range(repetitions):
        starter, ender = torch.cuda.Event(enable_timing=True),   torch.cuda.Event(enable_timing=True)
        starter.record()
        _ = model(dummy_input)
        ender.record()
        torch.cuda.synchronize()
        curr_time = starter.elapsed_time(ender)/1000
        total_time += curr_time
Throughput =   (repetitions*optimal_batch_size)/total_time
print('Final Throughput:',Throughput)
Conclusion
To accurately measure inference time of neural networks is not as trivial as it sounds. We detailed several issues that deep learning practitioners should be aware of, such as asynchronous execution and GPU power-saving modes. The PyTorch code presented here demonstrates how to correctly measure the timing in neural networks, despite the aforementioned caveats. Finally, we mentioned some common mistakes that cause people to measure inference time incorrectly. In future posts, we will dive even deeper into this topic and explain existing deep learning profilers which enable us to achieve even more accurate time measurements of networks. If you are interested in how to reduce the latency of the network without compromising its accuracy you are invited to read more about this topic in Deci’s white paper or book a demo with one of our experts.
参考:
https://deci.ai/the-correct-way-to-measure-inference-time-of-deep-neural-networks/


 浙公网安备 33010602011771号