【C++】Debugging Segmentation Faults

背景
linux下的程序,在遇到空指针解引用、栈错误等原因崩溃时,bash会输出一条:
Segmentation fault(core dump)
如果你看到core dumped字样,并且在目录下也找到了一个叫core的文件,那你可以直接用gdb定位到程序崩溃的位置。但是,我在实践中发现,在我的ubuntu 20.04环境下,程序段错误后找不到core文件。
- 检查是否开启core dump?
先用ulimit -c,如果看到0,说明没有开core dump。
所以我们输入ulimit -c unlimited,打开core dump。
再次用ulimit -c,看到unlimited了,说明core dump打开了。
- ulimit -c已经是unlimited了,怎么还是看不到core文件?
输入命令:
man 5 core
查看手册中的core内容,然后往下翻:
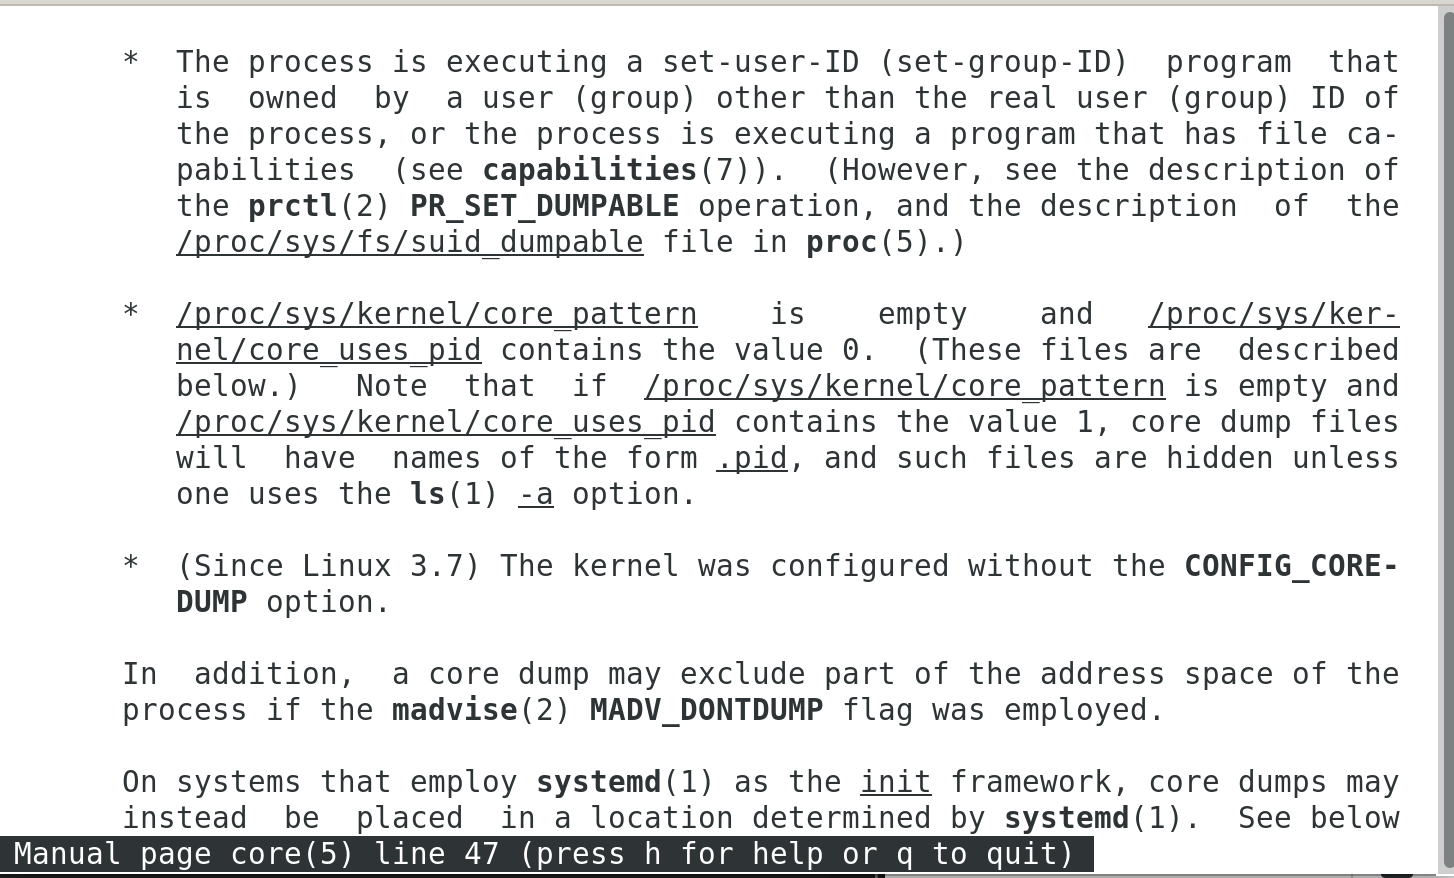
它这里面列举了几条不产生core文件的原因,你可以逐条对照。最有可能的原因是/proc/sys/kernel/core_pattern文件里面把你的core文件发送到别处去了。我的ubuntu系统默认就是这样干的。
然后打开/proc/sys/kernel/core_pattern文件,里面如果不是core的内容,表明它可能把你的core文件发到别的地方去了。那么则可以编辑这个文件,把内容改成core,然后保存。
另外有一种更简洁的方式,执行以下命令:
sudo service apport stop
然后你会发现,core_pattern的内容变为core了,这样core文件就可以正常生成了。
GDB
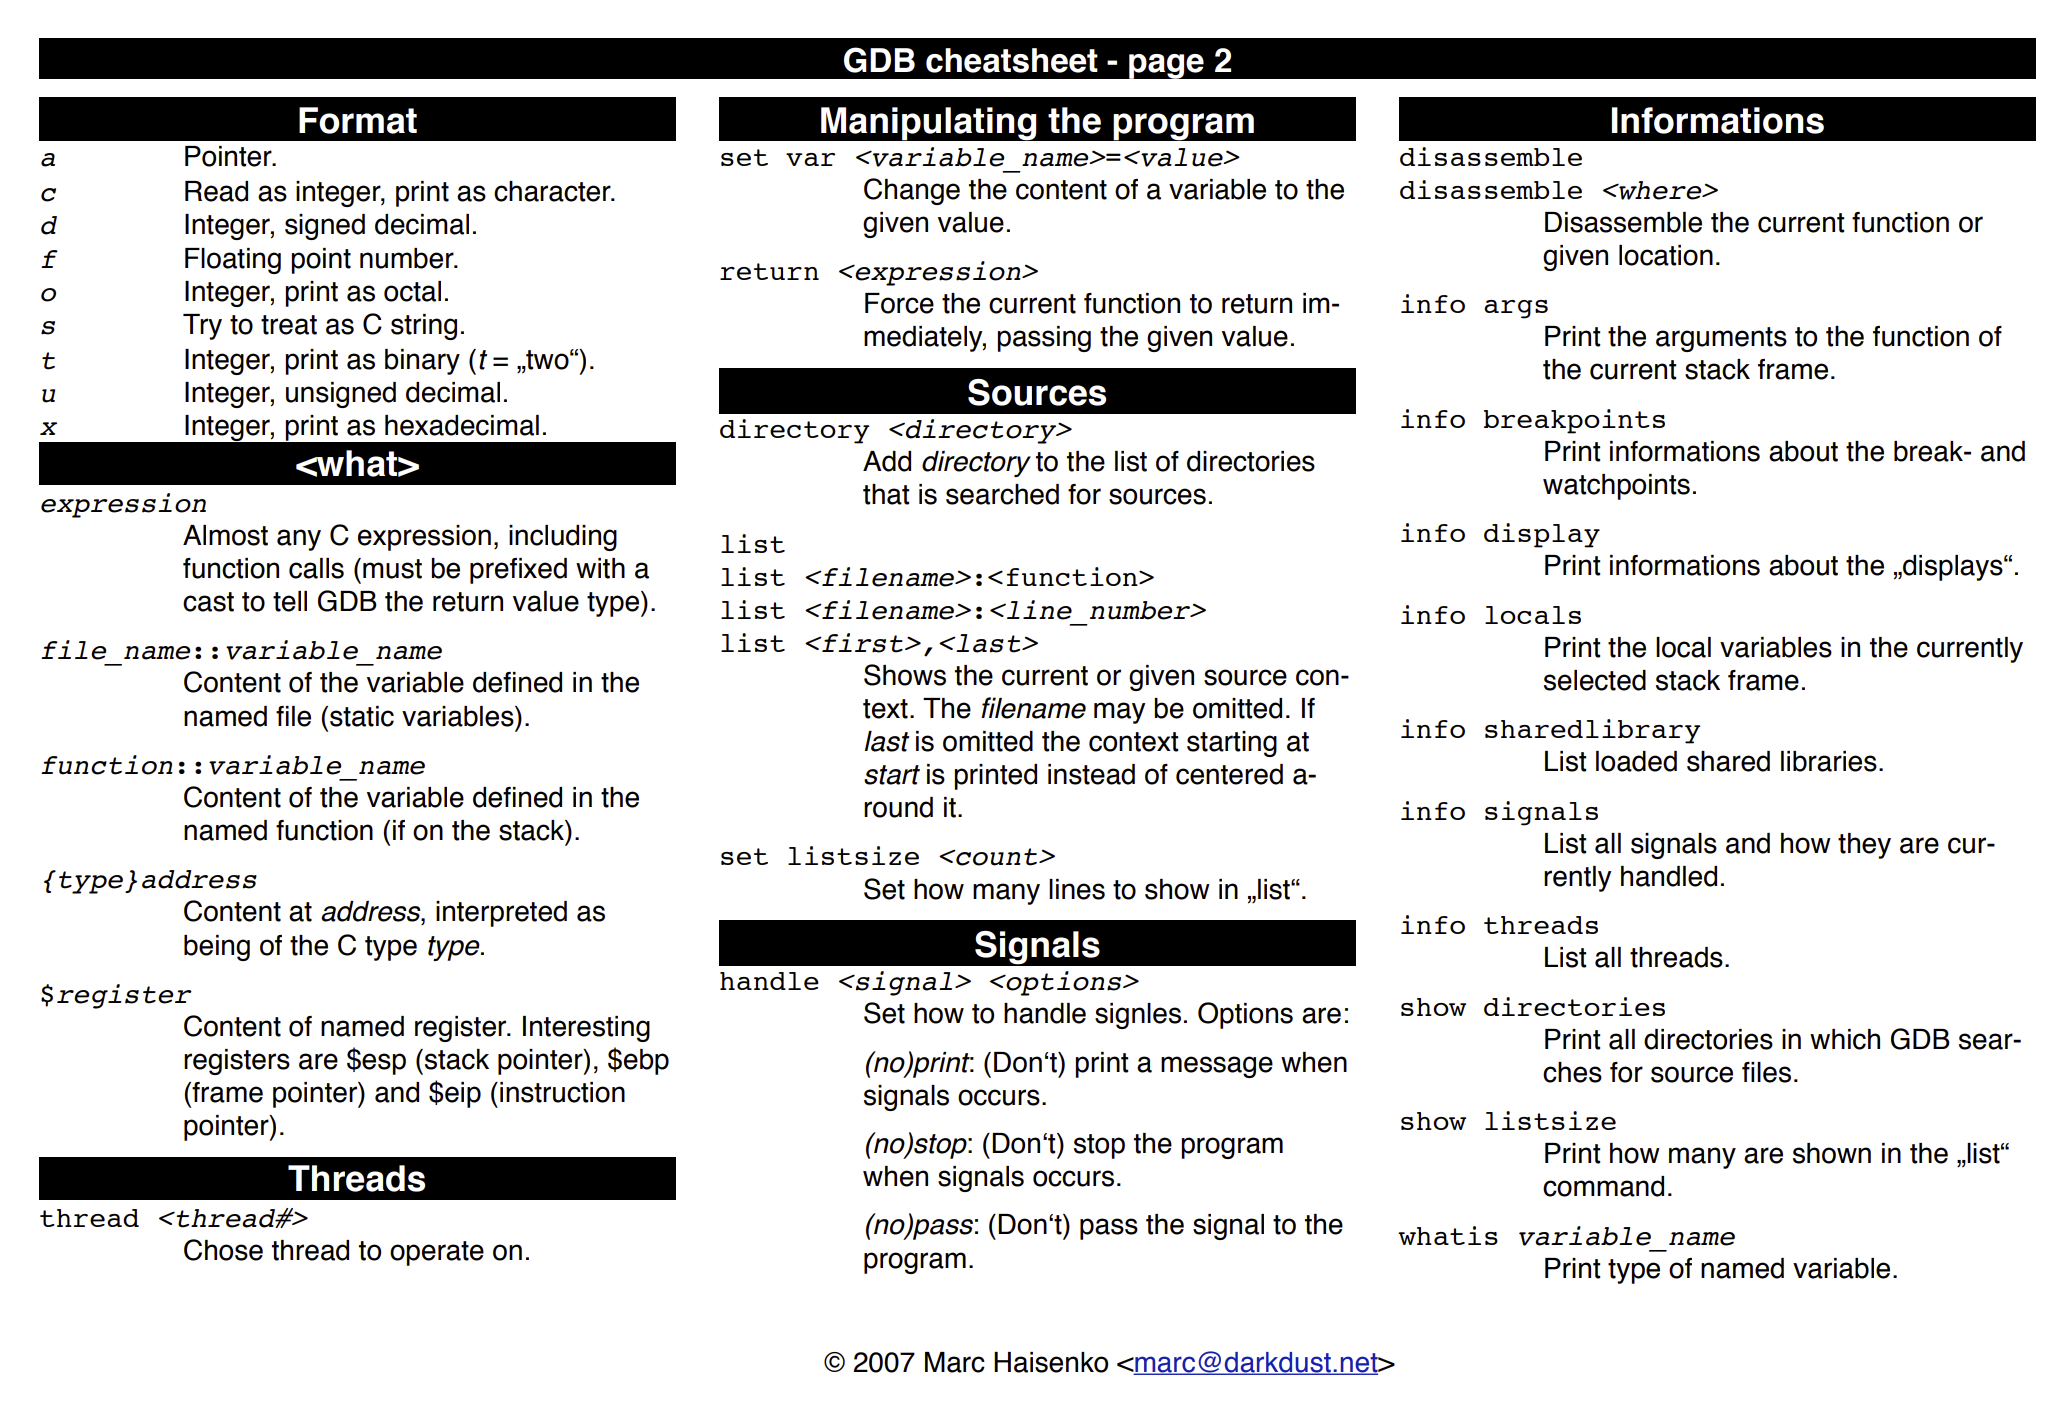
GDB is a powerful debugger that allows a programmer to step through their code line by line and probe any variable for its value at that step of execution. It has a lot of capability beyond what can be addressed in a simple primer. A very useful cheat sheet that I always have a printed copy of on my desk can be found here https://darkdust.net/files/GDB Cheat Sheet.pdf.

First and foremost, GDB will need some specific information injected into the executable that needs to be debugged. This requires compiling all of our code with the -g flag. The best way to do this is by adding it to your CXXFLAGS variable in your Makefile. That ensures that all automatically created *.o files are also built using the -g flag. You should also delete the old *.o files before rebuilding. This is a great time to run make clean, assuming you have a well-defined clean rule in your Makefile.
Now that you have recompiled with -g flags, you can fire up the debugger. The -tui flag below opens the source code in the top half of the screen which is great for adding some context to where the program is in the execution. gdb -tui a.out
If files were built with -g, the symbol table should load and GDB is ready to use. The first thing that is typically needed is to add one or more breakpoints. These can be added to method names, or to lines of code (if you specify a line that cannot break, the next breakable line is used).
Breaking on a specific line of source code
To halt execution at line 12 of test.cpp, you would simply type break test.cpp:12. Now when you type run, GDB starts executing and will halt at line 12 (or the next breakable line) so that you can inspect the status of your program.
Breaking on a method
If you suspect a specific method or function in your code, you can halt execution and inspect whenever that method is called. In order to inspect the method Search within the BinarySearch class, I would type break BinarySearch::Search(int*, int, int, int). As you might have guessed, this is a great time for tab-completion which GDB is great at. Just start typing the class or method name and hit tab in order to fill in the rest. Now when you type run, GDB starts executing and will halt the first (and every) time that method is called.
Stepping through
The commands needed to restart execution after a breakpoint has been reached are:
next- This goes to the next line of code, but will not dive into functions.step- This goes to the next line of instruction. This might be inside of a function call or elsewhere in the code tree.continue- This runs the program until the end of execution, or until a breakpoint is reached.
Looking at values
The simple act of stepping through code often helps figure out the problem. “This should not go inside that if statement”…well, it does, so figure out why.
Sometimes, it is not enough to just know the current location of your code execution. Luckily, we can print out values of our variables. print myVar would print the value of myVar. print &myVar would print the address of myVar. Pointers will print the address by default. To see their value, you would need to dereference, e.g. print *myPointer. As you might have noticed, the print statement is identical to sticking in std::cout statements, except that you don’t need to guess in advance, you can poke around until you find the values you need. Print will also let you call methods, so print myObject.GetSomeData() would print the results of the method call.
When breaking on a method call, the arguments passed to the call are printed automatically. For the BinarySearch breakpoint we mentioned earlier, when the breakpoint is triggered, the output might read:
Breakpoint 1, BinarySearch::Search (listOfNumbers=0x7fffffffc720, left=7, right=10, searchKey=10) at binary-search.cpp:5
->重要的一步:Debug Program With GDB Command
当我们得到了core dump文件后,那么接下来就可以debug了:
# Launch gdb with test program and core file
$ gdb ./test core
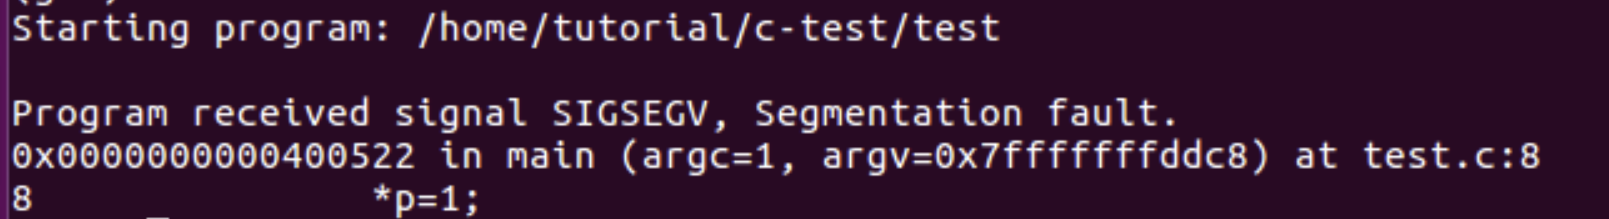
As you see, we are getting SIGSEGV signal from the OS because we are trying to access invalid memory access.
backtrace or bt --> It shows the stack frames. stack frames contain information about how one function is called to another function.
frame  --> To switch the particular frame

(gdb) bt
#0  0x0000000000400522 in main (argc=1, argv=0x7fffffffddc8) at test.c:8

# It is showing a frame 0 and will check this frame 0 with the below command

(gdb) frame 0
#0  0x0000000000400522 in main (argc=1, argv=0x7fffffffddc8) at test.c:8
8		*ptr=1;

(gdb) print ptr
$1 = (int *) 0x0
->案例分析:gdb调试堆栈信息诸如 #0 0x000... in ?? ()
Core was generated by `./analysis_service'.
Program terminated with signal SIGSEGV, Segmentation fault.
#0  0x00007fa59e5dd733 in ?? ()
gdb命令调用过程如下:
# Launch gdb with the program and core file
$ gdb ./analysis_service core
然后运行程序:
(gdb) run
打印线程信息:
(gdb) info threads
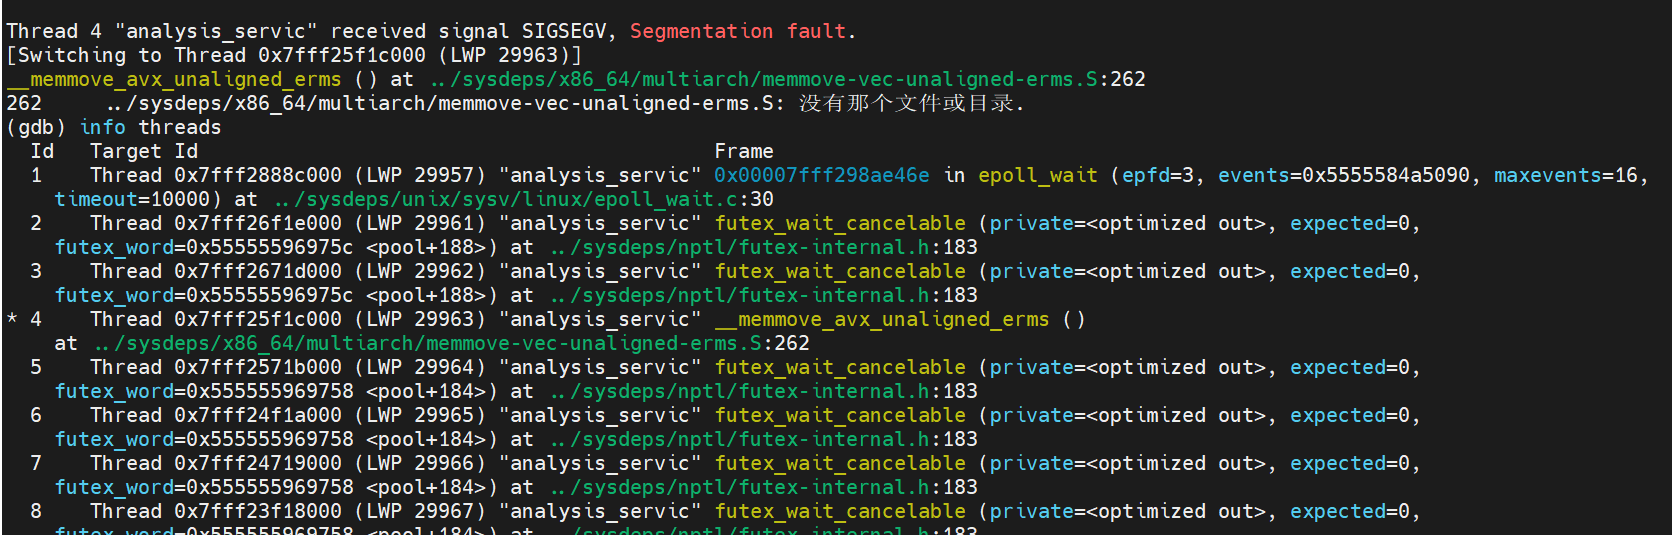
注意到已经切换到挂掉的线程0x7fff25f1c000 (LWP 29963),输入bt查看该线程中的堆栈信息:
(gdb) bt

这种一堆0和问号的问题多注意排查线程中memset和memcpy这种函数,初始化赋值或者拷贝内存的时候拷贝多了就有可能把线程的堆栈冲掉而导致出现堆栈信息为0?的现象。
参考:

 浙公网安备 33010602011771号