使用fabric.js生成的svg图制作echarts的map图表
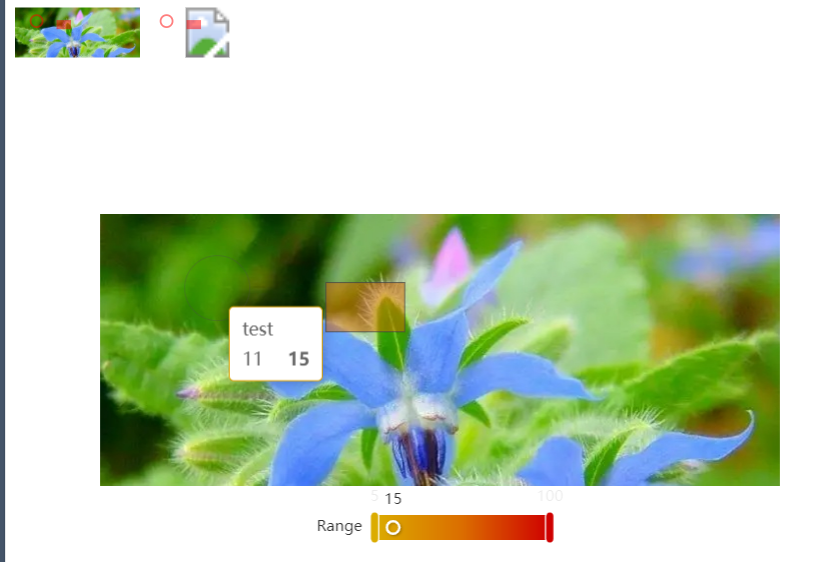
框选图片区域制作 echarts 图 这个需求的坑终于填的差不多了,写个 demo 记录下。
生成的 svg 图代码如下:可以看出 svg 部分节点有 name 属性,echarts 正是对应此 name 属性来显示具体数值。
<?xml version="1.0" encoding="UTF-8" standalone="no" ?>
<!DOCTYPE svg PUBLIC "-//W3C//DTD SVG 1.1//EN" "http://www.w3.org/Graphics/SVG/1.1/DTD/svg11.dtd">
<svg
  xmlns="http://www.w3.org/2000/svg"
  xmlns:xlink="http://www.w3.org/1999/xlink"
  version="1.1"
  width="690"
  height="276"
  viewBox="0 0 690 276"
  xml:space="preserve"
>
  <desc>Created with Fabric.js 5.3.0</desc>
  <defs></defs>
  <g transform="matrix(1 0 0 1 345 138)">
    <image
      style="
        stroke: none;
        stroke-width: 0;
        stroke-dasharray: none;
        stroke-linecap: butt;
        stroke-dashoffset: 0;
        stroke-linejoin: miter;
        stroke-miterlimit: 4;
        fill: rgb(0, 0, 0);
        fill-rule: nonzero;
        opacity: 1;
      "
      xlink:href="http://localhost:3000/images/2.jpg"
      x="-345"
      y="-138"
      width="690"
      height="276"
    ></image>
  </g>
  <g transform="matrix(1 0 0 1 71.47 72.5)">
    <rect
      style="
        stroke: none;
        stroke-width: 1;
        stroke-dasharray: none;
        stroke-linecap: butt;
        stroke-dashoffset: 0;
        stroke-linejoin: miter;
        stroke-miterlimit: 4;
        fill: rgb(255, 0, 0);
        fill-opacity: 0.5;
        fill-rule: nonzero;
        opacity: 1;
      "
      x="-10"
      y="-25"
      rx="0"
      ry="0"
      width="20"
      height="50"
      name="11"
    />
  </g>
  <g transform="matrix(0.33 0 0 0.33 151.11 80.44)">
    <g style="">
      <g transform="matrix(1 0 0 1 0 0)">
        <ellipse
          style="
            stroke: none;
            stroke-width: 1;
            stroke-dasharray: none;
            stroke-linecap: butt;
            stroke-dashoffset: 0;
            stroke-linejoin: miter;
            stroke-miterlimit: 4;
            fill: rgb(255, 0, 0);
            fill-opacity: 0.5;
            fill-rule: nonzero;
            opacity: 1;
          "
          cx="0"
          cy="0"
          rx="75"
          ry="75"
          name="12"
        />
      </g>
      <g transform="matrix(1 0 0 1 0 0)">
        <ellipse
          style="
            stroke: none;
            stroke-width: 1;
            stroke-dasharray: none;
            stroke-linecap: butt;
            stroke-dashoffset: 0;
            stroke-linejoin: miter;
            stroke-miterlimit: 4;
            fill: rgb(255, 255, 255);
            fill-opacity: 0.9;
            fill-rule: nonzero;
            opacity: 1;
          "
          cx="0"
          cy="0"
          rx="50"
          ry="50"
        />
      </g>
    </g>
  </g>
  <g transform="matrix(0.33 0 0 0.33 227.81 73.08)">
    <g style="">
      <g transform="matrix(1 0 0 1 0 0)">
        <ellipse
          style="
            stroke: none;
            stroke-width: 1;
            stroke-dasharray: none;
            stroke-linecap: butt;
            stroke-dashoffset: 0;
            stroke-linejoin: miter;
            stroke-miterlimit: 4;
            fill: rgb(255, 0, 0);
            fill-opacity: 0.5;
            fill-rule: nonzero;
            opacity: 1;
          "
          cx="0"
          cy="0"
          rx="75"
          ry="75"
          name="13"
        />
      </g>
      <g transform="matrix(1 0 0 1 0 0)">
        <ellipse
          style="
            stroke: none;
            stroke-width: 1;
            stroke-dasharray: none;
            stroke-linecap: butt;
            stroke-dashoffset: 0;
            stroke-linejoin: miter;
            stroke-miterlimit: 4;
            fill: rgb(255, 255, 255);
            fill-opacity: 0.9;
            fill-rule: nonzero;
            opacity: 1;
          "
          cx="0"
          cy="0"
          rx="50"
          ry="50"
        />
      </g>
    </g>
  </g>
  <g transform="matrix(1 0 0 1 120.45 138)">
    <rect
      style="
        stroke: none;
        stroke-width: 1;
        stroke-dasharray: none;
        stroke-linecap: butt;
        stroke-dashoffset: 0;
        stroke-linejoin: miter;
        stroke-miterlimit: 4;
        fill: rgb(255, 0, 0);
        fill-opacity: 0.5;
        fill-rule: nonzero;
        opacity: 1;
      "
      x="-10"
      y="-25"
      rx="0"
      ry="0"
      width="20"
      height="50"
      name="14"
    />
  </g>
  <g transform="matrix(1 0 0 1 223.4 157)">
    <rect
      style="
        stroke: none;
        stroke-width: 1;
        stroke-dasharray: none;
        stroke-linecap: butt;
        stroke-dashoffset: 0;
        stroke-linejoin: miter;
        stroke-miterlimit: 4;
        fill: rgb(255, 0, 0);
        fill-opacity: 0.5;
        fill-rule: nonzero;
        opacity: 1;
      "
      x="-10"
      y="-25"
      rx="0"
      ry="0"
      width="20"
      height="50"
      name="15"
    />
  </g>
</svg>
根据 svg 画图
<script src="../plugins/echarts.min.v5.4.2.js"></script>
<script src="../plugins/jquery/jquery-3.3.1.js"></script>
<body>
  <div>
    <!-- svg图片在html中引入方式:img、object、iframe -->
    <object type="image/svg+xml" data="http://localhost:3000/images/test.svg" width="100" height="100"></object>
    <img src="http://localhost:3000/images/test.svg" alt="" width="100" height="100" />
  </div>
  <div id="mapChart" style="height: 400px"></div>
  <script>
    function drawChart() {
      var chartDom = document.getElementById("mapChart");
      var myChart = echarts.init(chartDom);
      // var myChart = echarts.init(chartDom, null, { renderer: "svg" });
      var option;

      $.get("../images/test.svg", function (svg) {
        echarts.registerMap("test_map", { svg: svg });
        option = {
          tooltip: {},
          visualMap: {
            left: "center",
            bottom: "10%",
            min: 5,
            max: 100,
            orient: "horizontal",
            text: ["", "Range"],
            realtime: true,
            calculable: true,
            inRange: {
              color: ["#dbac00", "#db6e00", "#cf0000"],
            },
          },
          series: [
            {
              name: "test",
              type: "map",
              map: "test_map",
              roam: true,
              emphasis: {
                label: {
                  show: false,
                },
              },
              selectedMode: false,
              data: [
                { name: "11", value: 15 },
                { name: "12", value: 55 },
                { name: "13", value: 85 },
                { name: "14", value: 45 },
                { name: "15", value: 35 },
                { name: "ellipse", value: 85 },
                { name: "rect", value: 95 },
              ],
            },
          ],
        };
        myChart.setOption(option);
      });

      option && myChart.setOption(option);
    }

    drawChart();
  </script>
</body>

之前试用过使用 fabric 的 stroke 画圆,结果导出的 svg 图虽然可以正常显示,echarts 却无法识别
使用 img 标签导入的 svg 图不知道为什么背景图没显示,使用 object 导入的 svg 图显示正常
过程中遇到的 svg 图中嵌入的图片路径问题:
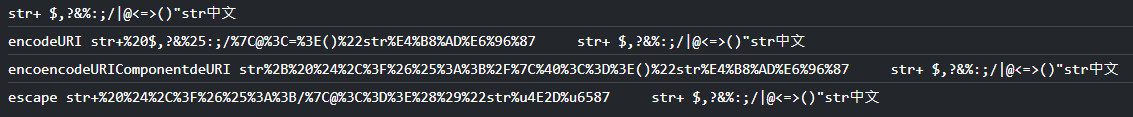
路径要使用 url,且要确保路径可访问,注意 url 中的空格等特殊字符需要转义
记录下各转义函数转义的字符:一般转义 url 的话 encodeURI 就够用了
<script>
  const str = 'str+ $,?&%:;/|@<=>()"str中文';
  console.log(str);
  const str1 = encodeURI(str);
  console.log("encodeURI", str1, "   ", decodeURI(str1));
  const str2 = encodeURIComponent(str);
  console.log("encoencodeURIComponentdeURI", str2, "   ", decodeURIComponent(str2));
  const str3 = escape(str);
  console.log("escape", str3, "   ", unescape(str3));
</script>

 浙公网安备 33010602011771号