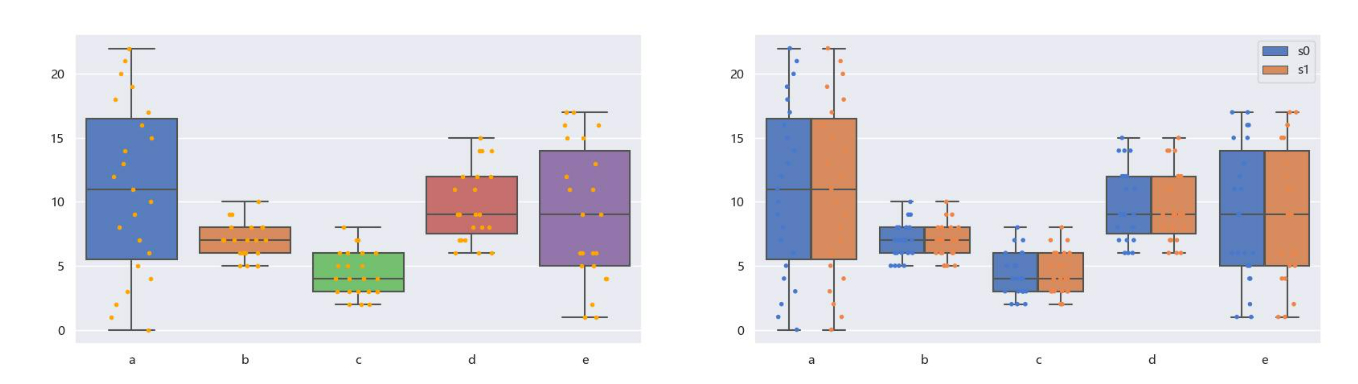
python3使用seaborn生成带有扰动点的分组箱型图
pd.csv
a,b,c,d,e
0,9,2,14,2
1,5,5,9,15
2,7,2,7,6
3,7,3,7,16
4,5,3,11,15
5,8,3,9,16
6,6,4,14,6
7,8,3,9,9
8,5,4,12,5
9,8,6,7,4
10,6,4,8,1
11,7,7,14,13
12,7,3,6,4
13,5,5,12,11
14,6,2,9,1
15,6,7,9,17
16,6,6,11,5
17,9,5,12,6
18,7,6,6,17
19,7,3,6,12
20,8,4,8,6
21,10,8,8,9
22,7,6,15,11
import seaborn as sns, pandas as pd, numpy as np
import matplotlib.pyplot as plt

# 解决中文不显示和负号不显示问题
rc = {"font.family": "Microsoft YaHei", "axes.unicode_minus": False}
fig = plt.figure(figsize=(20, 5))
sns.set(style="darkgrid", palette="muted", color_codes=True, rc=rc)

df = pd.read_csv("../../files/pd.csv")
df = df.T
rows, cols = df.shape

plt.subplot(1, 2, 1)
# 箱型图
xData = np.array([])
yData = np.array([])
for i in range(0, rows):
    yData = np.hstack((yData, df.iloc[i]))
    xData = np.hstack((xData, np.full(cols, df.index[i])))
# whis = [0, 100] 不显示异常点
sns.boxplot(x=xData, y=yData, whis=[0, 100])
sns.stripplot(x=xData, y=yData, color="orange", jitter=0.2, size=4, legend=False)


plt.subplot(1, 2, 2)
# 分组箱型图
xData = np.array([])
yData = np.array([])
zData = np.array([])
for i in range(2):
    for j in range(0, rows):
        yData = np.hstack((yData, df.iloc[j]))
        xData = np.hstack((xData, np.full(cols, df.index[j])))
        zData = np.hstack((zData, np.full(cols, "{}{}".format("s", i))))
# whis = [0, 100] 不显示异常点
sns.boxplot(x=xData, y=yData, hue=zData, whis=[0, 100])
# dodge=True 扰动点图分组
sns.stripplot(x=xData, y=yData, hue=zData, dodge=True, jitter=0.2, size=4, legend=False)
plt.savefig("../../files/gen/boxplot.jpg")

 浙公网安备 33010602011771号