leaflet实现风场流动
概述:本文基于《Openlayer4中风场的实现》一文,使用leaflet实现流动风场的效果。
废话不多说,下面贴上代码:
1、wind算法及扩展:
  1 /**
  2  * @author
  3  * @Date
  4  * 1.计算矩形4个角的canvas坐标x、y,初始化该区域所有网格点,间距可根据map index设置
  5  * 2.将已有的站点经纬度转换为canvas坐标
  6  * 3.插值法计算出每个网格点的风向、风速
  7  * 4.在该网格区域随机生成width*8个点,重复运动
  8  */
  9
 10 var Windy = function (options) {
 11     var MAX_PARTICLE_AGE = 100; //粒子最大运动次数
 12     var FRAME_RATE = 20; //重绘帧数
 13     var PARTICLE_MULTIPLIER = 8;
 14
 15     var canvas = options.canvas;
 16     var width = canvas.width;
 17     var height = canvas.height;
 18     var ctx = canvas.getContext('2d');
 19     ctx.lineWidth = .8;
 20     ctx.fillStyle = 'rgba(0,0,0,.97)';
 21     // ctx.strokeStyle = 'rgba(38,173,133,0.8)';
 22
 23     var buildBounds = function (extent, callback) {
 24         var upperLeft = extent[0];
 25         var lowerRight = extent[1];
 26         var bounds = {
 27             x: upperLeft[0],
 28             y: upperLeft[1],
 29             xmax: lowerRight[0],
 30             ymax: lowerRight[1],
 31             width: lowerRight[0] - upperLeft[0],
 32             height: lowerRight[1] - upperLeft[1]
 33         };
 34         callback(bounds);
 35     }
 36
 37     var createField = function (columns, bounds, callback) {
 38         function vector(x, y) {
 39             var column = columns[Math.floor(x)];
 40             return column && column[Math.floor(y)];
 41         }
 42
 43         vector.release = function () {
 44             columns = [];
 45         }
 46
 47         vector.randomize = function (o) {
 48             var x = Math.floor(Math.floor(Math.random() * bounds.width) + bounds.x);
 49             var y = Math.floor(Math.floor(Math.random() * bounds.height) + bounds.y);
 50             o.x = x;
 51             o.y = y;
 52             return o;
 53         }
 54         callback(bounds, vector);
 55     };
 56
 57     var interpolateGrid = function (bounds, stationPoints, callback) {
 58         var columns = [];
 59         var x = bounds.x;
 60
 61         function interpolateColumn(x) {
 62             var column = [];
 63             for (var y = bounds.y; y < bounds.ymax; y += 2) {
 64                 var wind = interpolate(x, y);
 65                 column[y + 1] = column[y] = wind;
 66             }
 67             columns[x + 1] = columns[x] = column;
 68         }
 69
 70         function interpolate(x, y) {
 71             var angle0 = 0,
 72                 angle1 = 0,
 73                 speed0 = 0,
 74                 speed1 = 0,
 75                 wind = {};
 76             stationPoints.forEach(function (s) {
 77                 angle0 += s.angle * 1.0 / ((y - s.y) * (y - s.y) + (x - s.x) * (x - s.x));
 78                 angle1 += 1.0 / ((y - s.y) * (y - s.y) + (x - s.x) * (x - s.x));
 79
 80                 speed0 += s.speed * 1.0 / ((y - s.y) * (y - s.y) + (x - s.x) * (x - s.x));
 81                 speed1 += 1.0 / ((y - s.y) * (y - s.y) + (x - s.x) * (x - s.x));
 82
 83                 if (angle1 != 0) {
 84                     wind.angle = angle0 / angle1;
 85                 }
 86                 if (speed1 != 0) {
 87                     wind.speed = speed0 / speed1;
 88                 }
 89             });
 90             return wind;
 91         }
 92
 93         (function batchInterpolate() {
 94             var start = Date.now();
 95             while (x < bounds.xmax) {
 96                 interpolateColumn(x);
 97                 x += 2;
 98                 if ((Date.now() - start) > 1000) { //MAX_TASK_TIME
 99                     setTimeout(batchInterpolate, 25);
100                     return;
101                 }
102             }
103             createField(columns, bounds, callback);
104         })();
105     };
106
107     var animate = function (bounds, vector) {
108         var particleCount = Math.round(bounds.width * PARTICLE_MULTIPLIER);
109         var particles = [];
110         for (var i = 0; i < particleCount; i++) {
111             particles.push(vector.randomize({
112                 age: Math.floor(Math.random() * MAX_PARTICLE_AGE)
113             }));
114         }
115
116         function evolve() {
117             particles.forEach(function (particle, i) {
118                 if (particle.age > MAX_PARTICLE_AGE) {
119                     particle = vector.randomize({
120                         age: 0
121                     });
122                     particles.splice(i, 1, particle);
123                 }
124                 var x = particle.x;
125                 var y = particle.y;
126                 var v = vector(x, y);
127                 if (v) {
128                     var xe = x - v.speed * Math.sin(Math.PI / 180 * (180 - v.angle));
129                     var ye = y - v.speed * Math.cos(Math.PI / 180 * (180 - v.angle));
130                     var nextPoint = vector(xe, ye);
131                     if (nextPoint) {
132                         particle.xe = xe;
133                         particle.ye = ye;
134                     } else {
135                         var newParticle = vector.randomize({
136                             age: Math.floor(Math.random() * MAX_PARTICLE_AGE)
137                         });
138                         particles.splice(i, 1, newParticle);
139                     }
140                 } else {
141                     particle.age = MAX_PARTICLE_AGE;
142                 }
143                 particle.age += 1;
144             });
145         }
146
147         function render() {
148             var prev = ctx.globalCompositeOperation;
149             ctx.globalCompositeOperation = "destination-in";
150             ctx.fillRect(0, 0, width, height);
151             ctx.globalCompositeOperation = prev;
152
153             ctx.beginPath();
154             // ctx.strokeStyle = 'rgba(23,139,231,.8)';
155             particles.forEach(function (particle, i) {
156                 ctx.moveTo(particle.x, particle.y);
157                 ctx.lineTo(particle.xe, particle.ye);
158                 particle.x = particle.xe;
159                 particle.y = particle.ye;
160             });
161             ctx.stroke();
162         }
163
164         (function frame() {
165             try {
166                 windy.timer = setTimeout(function () {
167                     requestAnimationFrame(frame);
168                     evolve();
169                     render();
170                 }, 1000 / FRAME_RATE);
171             } catch (e) {
172                 console.error(e);
173             }
174         })();
175     };
176
177     var start = function (extent, stationPoints) {
178         stop();
179         buildBounds(extent, function (bounds) {
180             interpolateGrid(bounds, stationPoints, function (bounds, vector) {
181                 windy.vector = vector;
182                 animate(bounds, vector);
183             });
184         });
185     };
186
187     var stop = function () {
188         ctx.clearRect(0, 0, width, height);
189         if (windy.vector) windy.vector.release();
190         if (windy.timer) clearTimeout(windy.timer);
191     };
192
193     var change = function (options) {
194         ctx.lineWidth = options.size;
195         ctx.strokeStyle = options.color;
196     }
197
198     var windy = {
199         options: options,
200         start: start,
201         stop: stop,
202         change: change
203     };
204
205     return windy;
206 };
207
208 window.requestAnimationFrame = (function () {
209     return window.requestAnimationFrame ||
210         window.webkitRequestAnimationFrame ||
211         window.mozRequestAnimationFrame ||
212         window.oRequestAnimationFrame ||
213         window.msRequestAnimationFrame ||
214         function (callback) {
215             window.setTimeout(callback, 1000 / 20);
216         };
217 })();
2、前端调用
  1 function addWindMap(){
  2             canvas = document.createElement('canvas');
  3             canvas.id = "windCanvas";
  4             canvas.width = map.getSize().x;
  5             canvas.height = map.getSize().y;
  6             canvas.style.position = 'absolute';
  7             canvas.style.top = 0;
  8             canvas.style.left = 0;
  9
 10             map.getContainer().appendChild(canvas);
 11             windy = new Windy({
 12                 map: map,
 13                 canvas: canvas,
 14                 data: windData
 15             });
 16
 17             function choice(data){
 18                 for(var i=0;i<data.length;i++){
 19                     if(data[i][3]>300){
 20                          return options2;
 21                     }else{
 22                         return options;
 23                     }
 24                 }
 25             }
 26
 27             var options = {
 28                size: .8,//控制线条粗细
 29                color: 'rgba(71,160,233,0.8)',//控制线条颜色
 30             };
 31             windy.change(options);
 32             windDraw();
 33
 34             map.on('movestart',function(){
 35                 windy.stop();
 36                 $(canvas).hide();
 37             });
 38             map.on("moveend",function(){
 39                 windDraw();
 40             });
 41         }
 42         function windDraw(){
 43             $(canvas).show();
 44             //leaflet中getBounds方法获得的是左上角和右下角的坐标
 45 //          var bounds = map.getBounds();
 46
 47 //          var bounds._southWest.lng = 112;
 48 //          var bounds._southWest.lat = 21;
 49 //          var bounds._northEast.lng = 115;
 50 //          var bounds._northEast.lat = 23;
 51             //设置bounds的经纬度范围可使其在指定范围内显示风场
 52             var bounds = [109,20,118,25];
 53 //          var _min = [bounds._southWest.lng, bounds._southWest.lat];
 54 //          var _max = [bounds._northEast.lng, bounds._northEast.lat];
 55             var _min = [bounds[0],bounds[1]];
 56             var _max = [bounds[2],bounds[3]];
 57
 58             _min.reverse();
 59             _max.reverse();
 60             var py = [0,0];
 61             canvas.style.left = py[0] + 'px';
 62             canvas.style.top = py[1] + 'px';
 63             var points = invertLatLon(py); //所有站点经纬度转为canvas坐标
 64             var min = map.latLngToContainerPoint(_min);
 65             var max = map.latLngToContainerPoint(_max);
 66
 67             var extent = [
 68                 [min.x - py[0], max.y - py[1]],
 69                 [max.x - py[0], min.y - py[1]]
 70             ];
 71
 72             windy.start(extent, points);
 73         }
 74
 75         function invertLatLon (py) {
 76             var points = [];
 77             windData.forEach(function (station) {
 78                 var px = map.latLngToContainerPoint([station[0], station[1]]);
 79
 80                 var x = px.x-py[0];
 81                 var y = px.y-py[1];
 82                 var angle = station[2];
 83                 var speed = station[3];
 84
 85                 points.push({
 86                      x,y,angle,speed
 87                 });
 88
 89             });
 90             return points;
 91
 92         }
 93         function drawcircle(latlng){
 94         var circle = L.circle(latlng, {
 95             color: 'red',
 96             fillColor: '#f03',
 97             fillOpacity: 0.5,
 98             radius: 500
 99 }).addTo(map);
100
101         }
102          for(var i=0;i<windData.length;i++){
103              drawcircle([windData[i][0],windData[i][1]]);
104          }
其实整体代码与原博主贴出的相差无几,只是有几处方法的调用上,openlayer与leaflet的方法不同,如:
1、第10行map.getContainer().appendChild(canvas);这是调用了leaflet中的getContainer的方法;而在原贴中是map.getViewport().appendChild(canvas);则是调用了openlayer中getViewport的方法;
2、第42行之后的windDraw方法,获取bounds的经纬度并将其转化为屏幕坐标,在leaflet中是调用getBounds来获取bounds的经纬度,再通过latLngToContainerPoint方法将其经纬度转换为屏幕坐标;在openlayer中则是通过map.getView().calculateExtent();来获取bounds的经纬度,再通过getPixelFromCoordinate()方法将经纬度转换为屏幕坐标;
展现效果:
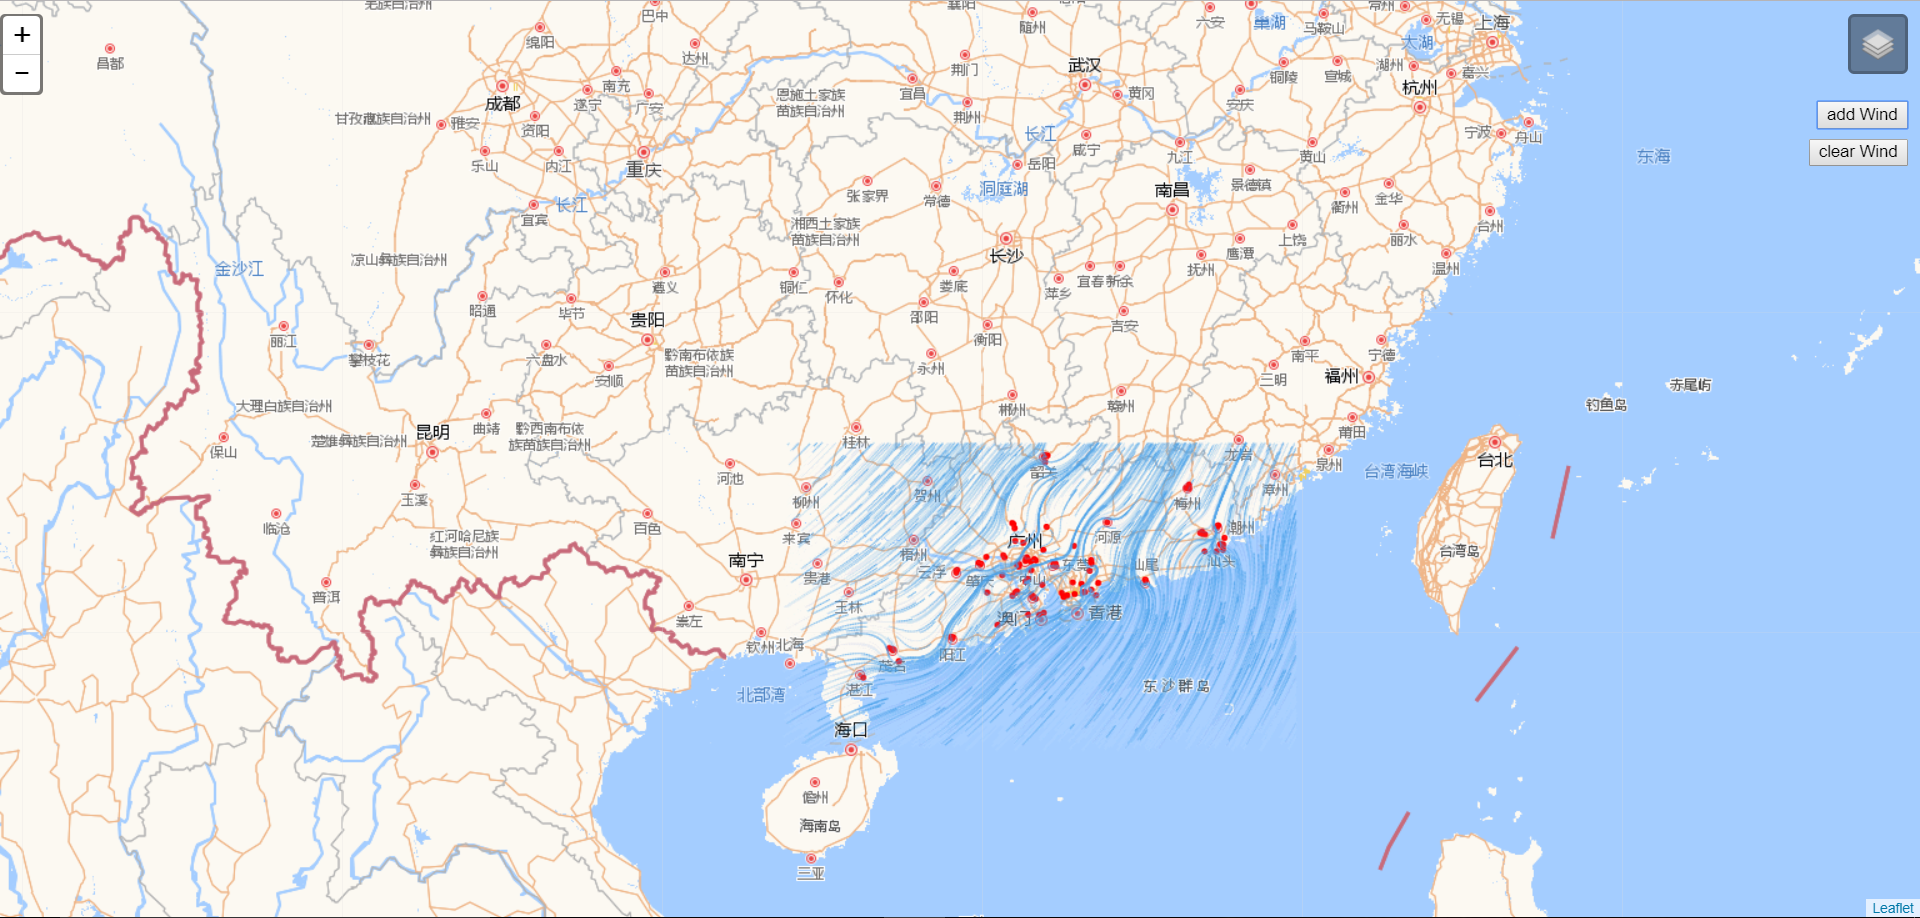
(红色的点为原始数据的所在点)
声明:本文是基于《Openlayer4中风场的实现》一文
原博文地址:http://blog.csdn.net/GISShiXiSheng/article/details/78130113?locationNum=8&fps=1
原博主联系方式:
q q:1004740957
e-mail:niujp08@qq.com
微信公众号:lzugis15
作者:一名GISer
本文版权归作者和博客园共有,欢迎转载,但未经作者同意必须保留此段声明,且在文章页面明显位置给出原文连接,否则保留追究法律责任的权利。

 浙公网安备 33010602011771号