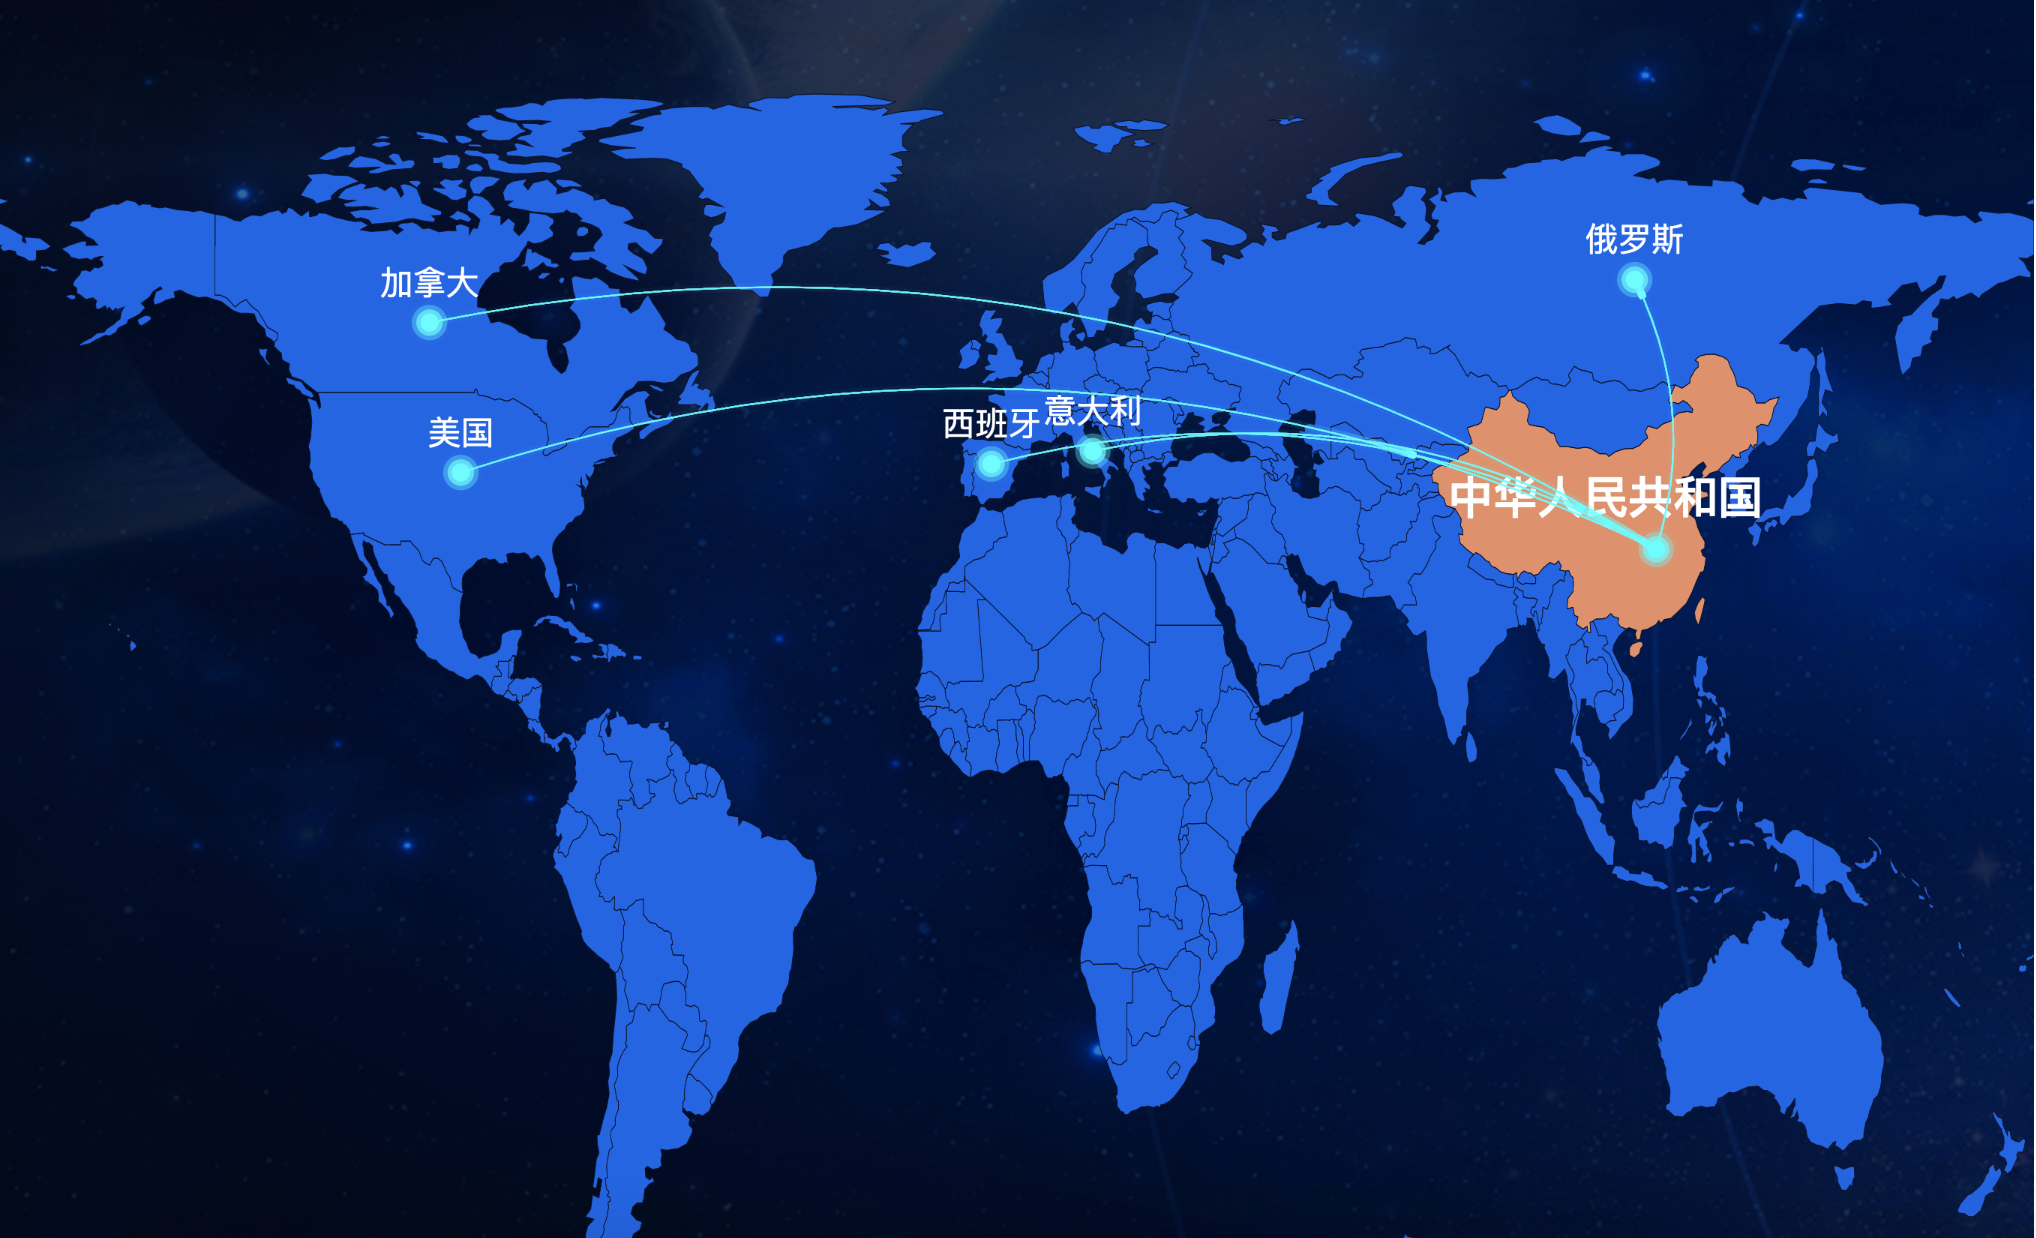
echarts实现地图漫入漫出效果
一、需求:效果图如下,各国家数据呈现流入中国效果(漫入)

二、前端如何实现
1. 实现方式:使用echarts,详细配置项可参见echarts官网
2. 实现分析:
- 地图实现可使用echarts的geo组件(geo: 地理坐标系). geo组件需要引入对应的地图数据,此处的引入方式是引入JSON 文件,通过 AJAX 异步加载后手动注册。
- 地图上的线动画效果可使用effect配置
- 地图上的城市坐标点可使用effectScatter配置
3. 代码如下:

<template>
  <view-template class="a2-roam">
    <div id="chart" style="width: 1360px; height:1200px;"></div>
  </view-template>
</template>
<script>
import echarts from 'echarts';

import world from '../assets/mapData/world_geo.json';
import worldGeoCoordMap from '../assets/mapData/worldPosition.js';

export default {
  data() {
    return {
      chart: null,
      color: ['#33ff77', '#fff066', '#00ffff', '#33ff77', '#fff066', '#00ffff', '#33ff77', '#fff066', '#00ffff', '#33ff77'],
      internationalRoamOutDataR: [],
      internationalRoaminDataLR: [],
      internationalRoamOutDataLR: [],
      option1: {
        geo: {
          map: 'world',
          left: 0,
          top: 300,
          right: 0,
          bottom: 100,
          silent: true,
          label: {
            normal: {
              show: false
            }
          },
          itemStyle: {
            normal: {
              areaColor: '#1d61ea',
              borderColor: '#0c0f26'
            }
          },
          regions: [
            {
              name: 'China',
              itemStyle: {
                normal: {
                  areaColor: '#e88f65'
                }
              },
              label: {
                normal: {
                  show: true,
                  fontSize: 30,
                  fontWeight: 'bold',
                  color: '#fff',
                  formatter() {
                    return '中华人民共和国'
                  }
                }
              }
            }
          ]
        },
        tooltip: {
          show: true,
          textStyle: {
            fontSize: 18,
            color: '#fff'
          }
        },
        series: [
          {
            seriesName: 'lines',
            type: 'lines',
            // 使用的坐标系
            coordinateSystem: 'geo',
            animation: true,
            zlevel: 10,
            label: {
              normal: {
                show: false
              },
              emphasis: {
                show: false
              }
            },
            // 线特效的配置
            effect: {
              show: true,
              period: 10,
              // color: 'linear-gradient(yellow, white)',
              symbol: 'roundRect',
              symbolSize: 5,
              trailLength: 0.5,
              loop: true
            },
            data: [
              {
                coords: [worldGeoCoordMap['俄罗斯'], worldGeoCoordMap['湖北']],
                lineStyle: {
                  normal: {
                    color: '#00ffff',
                    width: 1,
                    curveness: 0.2
                  }
                }
              },
              {
                coords: [worldGeoCoordMap['加拿大'], worldGeoCoordMap['湖北']],
                lineStyle: {
                  normal: {
                    color: '#00ffff',
                    width: 1,
                    curveness: 0.2
                  }
                }
              },
              {
                coords: [worldGeoCoordMap['西班牙'], worldGeoCoordMap['湖北']],
                lineStyle: {
                  normal: {
                    color: '#00ffff',
                    width: 1,
                    curveness: 0.2
                  }
                }
              },
              {
                coords: [worldGeoCoordMap['意大利'], worldGeoCoordMap['湖北']],
                lineStyle: {
                  normal: {
                    color: '#00ffff',
                    width: 1,
                    curveness: 0.2
                  }
                }
              },
              {
                coords: [worldGeoCoordMap['美国'], worldGeoCoordMap['湖北']],
                lineStyle: {
                  normal: {
                    color: '#00ffff',
                    width: 1,
                    curveness: 0.2
                  }
                }
              }
            ]
          },
          {
            seriesName: 'point',
            type: 'effectScatter',
            coordinateSystem: 'geo',
            tooltip: {
              show: true,
              formatter(params) {
                return params.name;
              }
            },
            symbolSize: 12,
            rippleEffect: {
              brushType: 'fill'
            },
            label: {
              normal: {
                show: true,
                formatter(params) {
                  return params.name;
                },
                color: '#fff',
                fontFamily: 'Microsoft Yahei',
                fontSize: 22,
                position: 'top',
                distance: 10
              }
            },
            zlevel: 99,
            data: [
              {
                name: '湖北',
                value: worldGeoCoordMap['湖北'],
                itemStyle: {
                  normal: {
                    color: '#00ffff'
                  }
                },
                label: {
                  normal: {
                    show: false
                  }
                }
              },
              {
                name: '俄罗斯',
                value: worldGeoCoordMap['俄罗斯'],
                itemStyle: {
                  normal: {
                    color: '#00ffff'
                  }
                }
              },
              {
                name: '西班牙',
                value: worldGeoCoordMap['西班牙'],
                itemStyle: {
                  normal: {
                    color: '#00ffff'
                  }
                }
              },
              {
                name: '加拿大',
                value: worldGeoCoordMap['加拿大'],
                itemStyle: {
                  normal: {
                    color: '#00ffff'
                  }
                }
              },
              {
                name: '意大利',
                value: worldGeoCoordMap['意大利'],
                itemStyle: {
                  normal: {
                    color: '#00ffff'
                  }
                }
              },
              {
                name: '美国',
                value: worldGeoCoordMap['美国'],
                itemStyle: {
                  normal: {
                    color: '#00ffff'
                  }
                }
              }
            ]
          }
        ]
      }
    }
  },
  mounted() {
    this.init();
  },
  methods: {
    // 初始化
    init() {
      echarts.registerMap('world', world);
      this.chart = echarts.init(document.getElementById('chart'));
      this.chart.setOption(this.option1);
    }
  },
  components: {
  },
  beforeDestroy() {
    if (this.chart) {
      this.chart.dispose();
    }
  }
}
</script>
tips: 代码要点提取:
- 首先定义一个echarts容器--id是chart的div
- 引入echarts、世界地图json文件、世界地图位置的js文件
- 这两个文件我已整理好,详情点击百度网盘链接 提取码: e6ah
- 手动注册地图echarts.registerMap('world', world)
- 定义echarts的配置项option(注意使用地理坐标系组件geo),并setOption。
致力于前端技术学习与分享,会及时更新博客。


