评估指标与评分(上):二分类指标
精度可以作为度量模型好坏的一个指标,它表示预测正确的样本数占所有样本数的比例。
但是在实践中,我们通常不仅对精确的预测感兴趣,还希望将这些预测结果用于更大的决策过程
1、 二分类指标
我们先看一下测量精度可能会怎么误导我们
1.1错误类型
⭐精度并不能很好地度量预测性能,因为我们所犯得错误并不包括我们感兴趣的所有信息:
例如:有一个自动化测试筛选癌症,如果测试结果为阴性,则认为该患者是健康的,若是阳性则需要进一步筛查。在这里我们将阳性测试结果称为正类,阴性结果称为负类,
于是就有了以下两种常见的错误类型:
第一类错误:假正例(错误的阳性预测,可能导致额外费用)
第二类错误:假反例(错误的阴性预测,可能使得病人无法及早发现病情,造成严重后果)
1.2不平衡数据集
⭐不平衡数据集:一个类别比另一个类别出现次数多很多的数据集
- 精度无法帮助我们区分:不变的‘未点击’模型与潜在的优秀模型
下面将用到:
- 两个虚拟分类器:dummy_majority(始终预测多数类),dummy(产生随机输出)
- 两个常用的分类模型:LogisticRegression,DecissionTree
创建数据集
  #创建一个不平衡数据集

  from sklearn.datasets import load_digits
  import numpy as np

  digits = load_digits()
  y = digits.target==9

  print("类别:{}".format(np.bincount(y)))

  '''
  `类别:[1617  180]`
  '''
建立四个模型
  from sklearn.dummy import DummyClassifier
  from sklearn.model_selection import train_test_split
  from sklearn.linear_model import LogisticRegression
  from sklearn.tree import DecisionTreeClassifier


  X_train,X_test,y_train,y_test = train_test_split(digits.data,y,random_state=0)

  #构建始终预测大多数的模型


  #始终预测多数类
  dummy_majority = DummyClassifier(strategy='most_frequent').fit(X_train,y_train)
  pred_most_frequent = dummy_majority.predict(X_test)

  print("始终预测多数类 Test score:{:.2f}".format(dummy_majority.score(X_test,y_test)))

  #产生随机输出
  dummy = DummyClassifier().fit(X_train,y_train)
  pred_dummy = dummy.predict(X_test)
  print("产生随机输出 Test score:{:.2f}".format(dummy.score(X_test,y_test)))


  #决策树
  tree = DecisionTreeClassifier(max_depth=2).fit(X_train,y_train)
  pred_tree = tree.predict(X_test)
  print("决策树 Test score:{:.2f}".format(tree.score(X_test,y_test)))

  #线性回归

  lrg = LogisticRegression(C=0.1).fit(X_train,y_train)
  pred_logreg = lrg.predict(X_test)
  print("线性回归 Test score:{:.2f}".format(lrg.score(X_test,y_test)))


  '''
  ```
  始终预测多数类 Test score:0.90
  产生随机输出 Test score:0.82
  决策树 Test score:0.92
  线性回归 Test score:0.98
  ```
  '''
📣
从上面我们可以发现,想要对这种不平衡的数据集评估性能,精度并不是一种合适的度量
- 因为竟然连随机输出的预测精度都达到了0.81
我们希望有一个指标可以淘汰这些无意义的预测(比如,预测多数类、随机预测等)
1.3 混淆矩阵
⭐对于二分类问题的评估结果,可以使用:混淆矩阵
  from sklearn.metrics import confusion_matrix

  #检查上面的LogisticRegression的评估结果

  confusion = confusion_matrix(y_test,pred_logreg)
  print("Confusion metrix:\n{}".format(confusion))

  '''
  ```
  Confusion metrix:
  [[402   1]
   [  6  41]]
  ```
  '''
  #混淆矩阵的含义
  mglearn.plots.plot_confusion_matrix_illustration()

📣
混淆矩阵主对角线上的元素对应正确的分类,
而其他元素则告诉我们一个类别中有多少样本被错误地划分到其他类别中

📣
二分类当中
我们将正类中正确分类的样本称为真正例(TP),将反类中正确分类的样本称为真反例(TN)
TP+FP+TN+FN:样本总数。
TP+FN:实际正样本数。
TP+FP:预测结果为正样本的总数,包括预测正确的和错误的。
FP+TN:实际负样本数。
TN+FN:预测结果为负样本的总数,包括预测正确的和错误的
⭐总结混淆矩阵最常见的方法:准确率和召回率
(1)准确率

⭐表示的是预测为正的样本中有多少是真正的正样本
目标:限制假正例的数量
(2)召回率

⭐表示的是样本中的正例有多少被预测为正类。
目标:找出所有正类样本,避免假反例
癌症诊断很适合!
(3)f1分数
⭐F1分数(F1 Score),是统计学中用来衡量二分类模型精确度的一种指标。
-
它同时兼顾了分类模型的精确率和召回率。
-
F1分数可以看作是模型精确率和召回率的一种调和平均,它的最大值是1,最小值是0。
from sklearn.metrics import f1_score

print("f1 score most frequent:{:.2f}".format(f1_score(y_test,pred_most_frequent)))
print("f1 score dummy:{:.2f}".format(f1_score(y_test,pred_dummy)))
print("f1 score tree:{:.2f}".format(f1_score(y_test,pred_tree)))
print("f1 score logisticregression:{:.2f}".format(f1_score(y_test,pred_logreg)))

'''
```
f1 score most frequent:0.00
f1 score dummy:0.12
f1 score tree:0.55
f1 score logisticregression:0.92
```
'''
📣
利用f1分数,我们可以总结预测性能,这个分数更加符合我们对好模型的直觉
  #用classification_report同时计算准确率,召回率,f1分数

  from sklearn.metrics import classification_report

  print(classification_report(y_test,pred_most_frequent,target_names=['not nine','nine']))

  '''
  ```
            precision    recall  f1-score   support

      not nine       0.90      1.00      0.94       403
          nine       0.00      0.00      0.00        47

      accuracy                           0.90       450
     macro avg       0.45      0.50      0.47       450
  weighted avg       0.80      0.90      0.85       450
  ```
  '''
(4)考虑不确定性
在sklean中大多数分类器提供了一个decision_fuction或者predict_proba方法来评估预测的不确定度
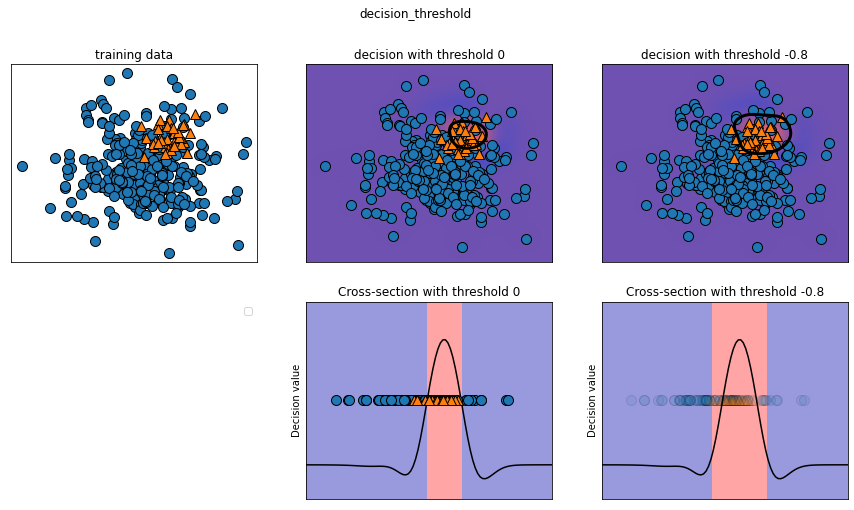
预测可以被看做是:以某个固定点作为decision_fuction或者predict_proba输出的阈值,样本点预测的不确定性超过阈值则被划分为正类/负类
而且,通过修改阈值我们可以改变模型的准确率和召回率
在二分类问题中:
- 使用0作为决策函数的阈值
- 0.5作为predict_proba的阈值
from sklearn.model_selection import train_test_split
from mglearn.datasets import make_blobs
from sklearn.svm import SVC
X,y=make_blobs(n_samples=(400,50), centers=2, cluster_std=(7,2), random_state=22)
X_train, X_test, y_train, y_test=train_test_split(X, y, random_state=22)
svc=SVC(gamma=0.5).fit(X_train, y_train)
mglearn.plots.plot_decision_threshold()

classification_report函数
  #使用classification_report函数来评估两个类别的准确率与召唤率

  print("Classification report values:")

  print(classification_report(y_test, svc.predict(X_test)))

  '''
  ```
  Classification report values:
                precision    recall  f1-score   support

             0       0.92      0.95      0.94       102
             1       0.38      0.27      0.32        11

      accuracy                           0.88       113
     macro avg       0.65      0.61      0.63       113
  weighted avg       0.87      0.88      0.88       113
  ```
  '''
📣
从运行结果得知,对于类别1,我们得到了一个相当低的准确率,
不过类别0的准确率却是不错,所以分类器将重点放在类别0分类正确,而不是类别1.
假设我们在应用中,类别1具有高召回率更加重要,如癌症筛查(我们允许自动筛查的时候自动检查到的为癌症的人通过人工检查没有得到癌症,但是不允许本人已经得到癌症了但是自动检查却将其漏过,这样会使得病人错过最佳治疗时期)。这意味着我们更愿意冒险有更多的假正例(假的类别为1),以换取更多的真正例(可以增大召回率)。
默认情况下,decision_function值大于0的点将被规划为类别1,我们希望将更多的点划为类别1,所以需要减少阈值。对应代码如下:
  y_pred_lower_threshold = svc.decision_function(X_test) > -.8

  #我们来看一下这个预测报告:

  print("The new Classification report values:")

  print(classification_report(y_test, y_pred_lower_threshold))

  '''
  ```
  The new Classification report values:
                precision    recall  f1-score   support

             0       0.94      0.87      0.90       102
             1       0.28      0.45      0.34        11

      accuracy                           0.83       113
     macro avg       0.61      0.66      0.62       113
  weighted avg       0.87      0.83      0.85       113
  ```
  '''
📣
通过调整后,类别1的召回率增大,准确率降低。
但是得到了更大的空间区域化为类别1.
如果需要的是更高的准确率的话,那么也通过改变与之的方法得到更好的结果。
(5)准确率-召回率曲线
⭐一旦设定了一个具体目标(比如对某一类别的特定召回率或准确率),就可以适当的设定一个阈值
工作点:对分类器设置要求(比如90%的召回率)
but,在工作中,我们并不完全清楚工作点在哪里。因此,为了更好地理解建模问题,很有启发性的做法是:
- 同时查看所有完全可能的阈值或者准确率和召回率:
- 准确率-召回率曲线
- sklearn.metrics模块(参数:真实标签,预测的不确定度,后者由decision_function或者predict_proba给出)
  from sklearn.metrics import precision_recall_curve
  import numpy as np
  from matplotlib import pyplot as plt


  #利用返回的准确率和召回率,阈值,我们可以绘制一条曲线
  X,y=make_blobs(n_samples=(4000,500), centers=2, cluster_std=(7,2), random_state=22)

  X_train, X_test, y_train, y_test=train_test_split(X, y, random_state=22)

  svc=SVC(gamma=0.05).fit(X_train, y_train)


  precision,recall,thresholds = precision_recall_curve(y_test,svc.decision_function(X_test))

  close_zero = np.argmin(np.abs(thresholds)) #找到最接近0的阈值

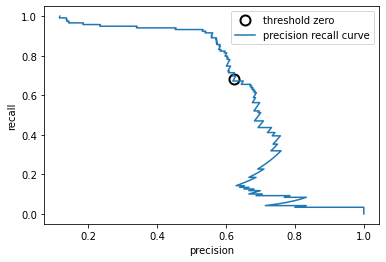
  plt.plot(precision[close_zero],recall[close_zero],'o',markersize=10,label="threshold zero",fillstyle='none',c='k',mew=2)
  plt.plot(precision,recall,label='precision recall curve')
  plt.xlabel("precision")
  plt.ylabel("recall")
  plt.legend()

📣
黑色圆圈表示阈值为0的点,0是decision_function的默认值
利用这个模型可以得到约0.5的准确率,同时保持很高的召回率。
曲线左侧相对平坦,说明在准确率提高的同时召回率没有下降很多。
曲线越靠近右上角,则分类器越好(有高recall和高precision)
⭐
f1-分数只反映了准确率-召回率曲线上的一个点,即默认阈值对应的那个点。
对于自动化模型对比,我们可能希望总结曲线中包含的信息,而不限于某个特定的阈值或工作点
总结准确率-召回率曲线的一种方法是:计算该曲线下的积分或面积,也叫做平均准确率
- average_precision_score函数来计算平均准确率
(6)受试者工作特征(ROC)与AUC
⭐ROC曲线图是反映敏感性与特异性之间关系的曲线。
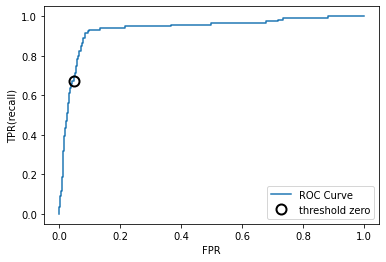
横坐标X轴为 1 – 特异性,也称为假阳性率(误报率),X轴越接近零准确率越高;
纵坐标Y轴称为敏感度,也称为真阳性率(敏感度),Y轴越大代表准确率越好。
根据曲线位置,把整个图划分成了两部分,曲线下方部分的面积被称为AUC(Area Under Curve),用来表示预测准确性,
AUC值越高,也就是曲线下方面积越大,说明预测准确率越高。
曲线越接近左上角(X越小,Y越大),预测准确率越高。
  from sklearn.metrics import roc_curve
  fpr,tpr,thresholds = roc_curve(y_test,svc.decision_function(X_test))

  #画图
  plt.plot(fpr,tpr,label='ROC Curve')
  plt.xlabel("FPR")
  plt.ylabel("TPR(recall)")

  #找到最接近于0的阈值
  close_zero = np.argmin(np.abs(thresholds)) #找到最接近0的阈值
  plt.plot(fpr[close_zero],tpr[close_zero],'o',markersize=10,label="threshold zero",fillstyle='none',c='k',mew=2)
  plt.legend()

📣
ROC曲线:理想的曲线要靠近左上角
-
分类器的召回率很高,同时保证假正率很低
#用一个数字来总结ROC曲线:曲线下的面积(AUC)
#roc_auc_score

from sklearn.metrics import roc_auc_score

svc_auc = roc_auc_score(y_test,svc.decision_function(X_test))
print("AUC for SVC:{:.3f}".format(svc_auc))

'''
`AUC for SVC:0.936`
'''
对于不平衡的分类问题来说,AUC是一个比精度好得多的指标.
2、参考文献
《python机器学习基础教程》


【推荐】国内首个AI IDE,深度理解中文开发场景,立即下载体验Trae
【推荐】编程新体验,更懂你的AI,立即体验豆包MarsCode编程助手
【推荐】抖音旗下AI助手豆包,你的智能百科全书,全免费不限次数
【推荐】轻量又高性能的 SSH 工具 IShell:AI 加持,快人一步
· 25岁的心里话
· 闲置电脑爆改个人服务器(超详细) #公网映射 #Vmware虚拟网络编辑器
· 零经验选手,Compose 一天开发一款小游戏!
· 因为Apifox不支持离线,我果断选择了Apipost!
· 通过 API 将Deepseek响应流式内容输出到前端