数据表示与特征工程--单变量非线性变换
特征和目标之间存在非线性关系,建模变得很困难
⭐log和exp函数可以帮助调节数据的相对比例,改进线性模型或者神经网络的学习效果
⭐大部分模型在每个特征遵循高斯分布时表现很好
⭐在处理整数计数数据时,这种log,exp变换非常有用
1、模拟一些数据
模拟钟形分布的数据
  from sklearn.linear_model import Ridge
  from sklearn.model_selection import train_test_split
  import numpy as np
  from matplotlib import pyplot as plt
  rnd = np.random.RandomState(0)
  X_org = rnd.normal(size=(1000,3))
  w = rnd.normal(size=3)

  #对X_org应用exp
  X = rnd.poisson(10*np.exp(X_org)) #获取泊松分布的随机样本
  y = np.dot(X_org,w)

  #输出:X_org

  '''
  ```
  array([[ 1.76405235,  0.40015721,  0.97873798],
         [ 2.2408932 ,  1.86755799, -0.97727788],
         [ 0.95008842, -0.15135721, -0.10321885],
         ...,
         [-1.30322008,  0.46675065,  0.16110632],
         [ 0.32003193,  2.07917666, -0.90746598],
         [-0.19240421, -1.21251574, -0.08059852]])
  ```
  '''
  #看一下w内容
  '''
  array([ 1.59327362,  0.5687224 , -0.11448705])`
  '''

  np.bincount(X[:,0])
  '''
  array([28, 38, 68, 48, 61, 59, 45, 56, 37, 40, 35, 34, 36, 26, 23, 26, 27,
         21, 23, 23, 18, 21, 10,  9, 17,  9,  7, 14, 12,  7,  3,  8,  4,  5,
          5,  3,  4,  2,  4,  1,  1,  3,  2,  5,  3,  8,  2,  5,  2,  1,  2,
          3,  3,  2,  2,  3,  3,  0,  1,  2,  1,  0,  0,  3,  1,  0,  0,  0,
          1,  3,  0,  1,  0,  2,  0,  1,  1,  0,  0,  0,  0,  1,  0,  0,  2,
          2,  0,  1,  1,  0,  0,  0,  0,  1,  1,  0,  0,  0,  0,  0,  0,  0,
          1,  0,  0,  0,  0,  0,  1,  1,  0,  0,  1,  0,  0,  0,  0,  0,  0,
          0,  1,  0,  0,  0,  0,  1,  0,  0,  0,  0,  0,  0,  0,  0,  0,  0,
          0,  0,  0,  0,  1], dtype=int64)
  '''


  bins = np.bincount(X[:,0])
  plt.bar(range(len(bins)),bins)
  plt.ylabel('Number of appearences')
  plt.xlabel('Value')
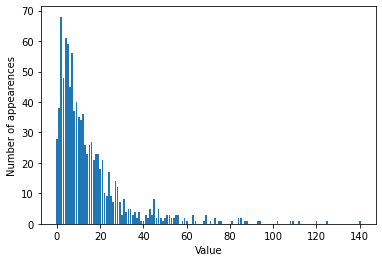
📣
可以发现X[:,0]呈现泊松分布,X的其他特征也有类似的性质
- 这种类型的数据(许多较小的值和一些非常大的值)在实践中非常常见。
- 但是大多数线性模型无法很好地处理这种数据
2、拟合一个岭回归模型
2.1 原始数据直接应用
  X_train, X_test, y_train, y_test = train_test_split(X,y,random_state=0)
  score = Ridge().fit(X_train,y_train).score(X_test,y_test)
  print("Test score:{}".format(score))

  '''
  Test score:0.6224186236310756`
  '''
📣
rigde无法真正捕捉到X和y的关系 应用对数变换可能有用,由于数据取值包括0,我们不能直接应用log,要计算log(X+1)
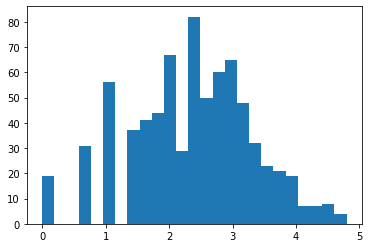
2.2 log变换
  X_train_log = np.log(X_train+1)
  X_test_log = np.log(X_test+1)

  plt.hist(X_train_log[:,0],bins=25)
  #岭回归
  score = Ridge().fit(X_train_log,y_train).score(X_test_log,y_test)
  print("Test score:{}".format(score))
  '''
  Test score:0.8749342372887816`
  '''
📣
有时,只对部分数据进行变换,对基于树的模型而言,这种变换不重要,但对线性模型来说至关重要的。
对于复杂度较低的线性模型,分箱、多项式和交互式有很大的提升,对较复杂的模型影响就没那么大了。
基于树的模型通常能够自己发现重要的交互项,大多数情况下不需要显式地变换数据。
⭐对回归的目标变量y进行变换有时也是一个好主意 log(y+1)
3、参考文献
《python机器学习基础教程》

 浙公网安备 33010602011771号