SpringBoot 2.x + Prometheus + Grafana 实现应用监控
1. 简介#
提到监控系统,zabbix具有绝对的地位,它提供分布式系统监视以及网络监视功能的企业级的开源解决方案,能监视各种网络参数,保证服务器系统的安全运营,并提供灵活的通知机制以让系统管理员快速定位/解决存在的各种问题。但是针对于容器监控却有点力不从心,因此出现了Prometheus。Prometheus是一个开源的服务监控系统时间序列数据库,通过Http请求拉取被监控的服务暴露的端点公开的度量列表和值,然后存放到时序数据库中。最好再通过 Grafana的Dashboard进行图表展示分析和告警。
本文基于SpringBoot 2.3.4.RELEASE版本开发的应用,通过Prometheus采集数据,最后通过Grafana可视化监控。
2. 结构图#

3. 相关博客#
Docker部署SpringBoot项目
Docker 配置国内镜像源加速
4. SpirngBoot应用#
- 创建项目
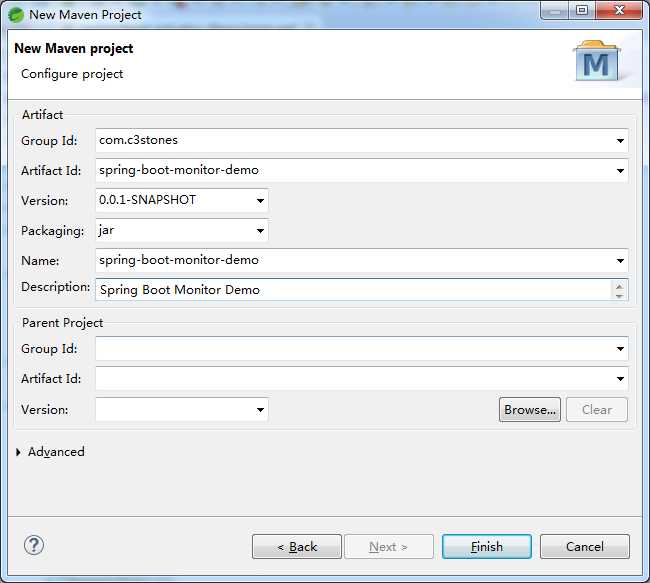
- 修改pom.xml
<project xmlns="http://maven.apache.org/POM/4.0.0"
xmlns:xsi="http://www.w3.org/2001/XMLSchema-instance"
xsi:schemaLocation="http://maven.apache.org/POM/4.0.0 https://maven.apache.org/xsd/maven-4.0.0.xsd">
<modelVersion>4.0.0</modelVersion>
<groupId>com.c3stones</groupId>
<artifactId>spring-boot-monitor-demo</artifactId>
<version>0.0.1-SNAPSHOT</version>
<name>spring-boot-monitor-demo</name>
<description>Spring Boot Monitor Demo</description>
<parent>
<groupId>org.springframework.boot</groupId>
<artifactId>spring-boot-starter-parent</artifactId>
<version>2.3.4.RELEASE</version>
</parent>
<dependencies>
<dependency>
<groupId>org.springframework.boot</groupId>
<artifactId>spring-boot-starter-actuator</artifactId>
</dependency>
<dependency>
<groupId>org.springframework.boot</groupId>
<artifactId>spring-boot-starter-security</artifactId>
</dependency>
<dependency>
<groupId>io.micrometer</groupId>
<artifactId>micrometer-registry-prometheus</artifactId>
</dependency>
<dependency>
<groupId>org.springframework.boot</groupId>
<artifactId>spring-boot-starter-web</artifactId>
</dependency>
</dependencies>
<build>
<plugins>
<plugin>
<groupId>org.springframework.boot</groupId>
<artifactId>spring-boot-maven-plugin</artifactId>
</plugin>
</plugins>
</build>
</project>
- 创建测试Controller,提供1000个线程方法
import org.slf4j.Logger;
import org.slf4j.LoggerFactory;
import org.springframework.web.bind.annotation.RequestMapping;
import org.springframework.web.bind.annotation.RestController;
/**
* 测试Controller
*
* @author CL
*
*/
@RestController
@RequestMapping("/test")
public class TestController {
private static final Logger logger = LoggerFactory.getLogger(TestController.class);
/**
* 创建线程
*
* @return
*/
@RequestMapping("")
public String test() {
for (int i = 0; i < 1000; i++) {
new Thread(() -> {
logger.info(Thread.currentThread().getName());
}).start();
}
return "success";
}
}
- 创建启动类
import org.springframework.boot.SpringApplication;
import org.springframework.boot.autoconfigure.SpringBootApplication;
/**
* 启动类
*
* @author CL
*
*/
@SpringBootApplication
public class Application {
public static void main(String[] args) {
SpringApplication.run(Application.class, args);
}
}
- 在resources目录下创建application.yml配置文件
server:
port: 8888
spring:
application:
name: monitor-demo
security:
user:
name: admin
password: 123456
management:
endpoints:
web:
exposure:
include: "*"
- 打包,构建镜像并创建启动容器
Docker部署SpringBoot项目 - 访问端点指标
浏览器访问:http://192.168.0.100:8888/actuator/prometheus,输入用户名密码:admin/123456
# HELP jvm_classes_unloaded_classes_total The total number of classes unloaded since the Java virtual machine has started execution
# TYPE jvm_classes_unloaded_classes_total counter
jvm_classes_unloaded_classes_total 42.0
# HELP process_files_max_files The maximum file descriptor count
# TYPE process_files_max_files gauge
process_files_max_files 1048576.0
# HELP process_uptime_seconds The uptime of the Java virtual machine
# TYPE process_uptime_seconds gauge
process_uptime_seconds 86485.79
# HELP http_server_requests_seconds
# TYPE http_server_requests_seconds summary
http_server_requests_seconds_count{exception="None",method="POST",outcome="CLIENT_ERROR",status="403",uri="root",} 3.0
http_server_requests_seconds_sum{exception="None",method="POST",outcome="CLIENT_ERROR",status="403",uri="root",} 0.001568066
http_server_requests_seconds_count{exception="None",method="GET",outcome="SUCCESS",status="200",uri="/actuator/prometheus",} 17295.0
http_server_requests_seconds_sum{exception="None",method="GET",outcome="SUCCESS",status="200",uri="/actuator/prometheus",} 1427.974367889
http_server_requests_seconds_count{exception="None",method="GET",outcome="CLIENT_ERROR",status="401",uri="root",} 14.0
http_server_requests_seconds_sum{exception="None",method="GET",outcome="CLIENT_ERROR",status="401",uri="root",} 0.00942257
http_server_requests_seconds_count{exception="None",method="GET",outcome="SUCCESS",status="200",uri="root",} 10.0
http_server_requests_seconds_sum{exception="None",method="GET",outcome="SUCCESS",status="200",uri="root",} 0.011407972
http_server_requests_seconds_count{exception="None",method="GET",outcome="REDIRECTION",status="302",uri="REDIRECTION",} 10.0
http_server_requests_seconds_sum{exception="None",method="GET",outcome="REDIRECTION",status="302",uri="REDIRECTION",} 0.024425922
http_server_requests_seconds_count{exception="None",method="POST",outcome="REDIRECTION",status="302",uri="REDIRECTION",} 3.0
http_server_requests_seconds_sum{exception="None",method="POST",outcome="REDIRECTION",status="302",uri="REDIRECTION",} 0.238687857
# HELP http_server_requests_seconds_max
# TYPE http_server_requests_seconds_max gauge
http_server_requests_seconds_max{exception="None",method="POST",outcome="CLIENT_ERROR",status="403",uri="root",} 0.0
http_server_requests_seconds_max{exception="None",method="GET",outcome="SUCCESS",status="200",uri="/actuator/prometheus",} 0.088958634
http_server_requests_seconds_max{exception="None",method="GET",outcome="CLIENT_ERROR",status="401",uri="root",} 0.0
http_server_requests_seconds_max{exception="None",method="GET",outcome="SUCCESS",status="200",uri="root",} 0.005014716
http_server_requests_seconds_max{exception="None",method="GET",outcome="REDIRECTION",status="302",uri="REDIRECTION",} 8.23672E-4
http_server_requests_seconds_max{exception="None",method="POST",outcome="REDIRECTION",status="302",uri="REDIRECTION",} 0.079363784
# HELP jvm_gc_memory_allocated_bytes_total Incremented for an increase in the size of the young generation memory pool after one GC to before the next
# TYPE jvm_gc_memory_allocated_bytes_total counter
jvm_gc_memory_allocated_bytes_total 7.587038248E9
# HELP jvm_memory_max_bytes The maximum amount of memory in bytes that can be used for memory management
# TYPE jvm_memory_max_bytes gauge
jvm_memory_max_bytes{area="heap",id="Tenured Gen",} 3.21585152E8
jvm_memory_max_bytes{area="heap",id="Eden Space",} 1.28647168E8
jvm_memory_max_bytes{area="nonheap",id="Metaspace",} -1.0
jvm_memory_max_bytes{area="nonheap",id="Code Cache",} 2.5165824E8
jvm_memory_max_bytes{area="heap",id="Survivor Space",} 1.605632E7
jvm_memory_max_bytes{area="nonheap",id="Compressed Class Space",} 1.073741824E9
# HELP jvm_buffer_memory_used_bytes An estimate of the memory that the Java virtual machine is using for this buffer pool
# TYPE jvm_buffer_memory_used_bytes gauge
jvm_buffer_memory_used_bytes{id="direct",} 81920.0
jvm_buffer_memory_used_bytes{id="mapped",} 0.0
# HELP jvm_memory_committed_bytes The amount of memory in bytes that is committed for the Java virtual machine to use
# TYPE jvm_memory_committed_bytes gauge
jvm_memory_committed_bytes{area="heap",id="Tenured Gen",} 2.301952E7
jvm_memory_committed_bytes{area="heap",id="Eden Space",} 9306112.0
jvm_memory_committed_bytes{area="nonheap",id="Metaspace",} 4.3384832E7
jvm_memory_committed_bytes{area="nonheap",id="Code Cache",} 2.1233664E7
jvm_memory_committed_bytes{area="heap",id="Survivor Space",} 1114112.0
jvm_memory_committed_bytes{area="nonheap",id="Compressed Class Space",} 5636096.0
# HELP jvm_threads_peak_threads The peak live thread count since the Java virtual machine started or peak was reset
# TYPE jvm_threads_peak_threads gauge
jvm_threads_peak_threads 20.0
# HELP jvm_classes_loaded_classes The number of classes that are currently loaded in the Java virtual machine
# TYPE jvm_classes_loaded_classes gauge
jvm_classes_loaded_classes 7533.0
# HELP jvm_gc_max_data_size_bytes Max size of old generation memory pool
# TYPE jvm_gc_max_data_size_bytes gauge
jvm_gc_max_data_size_bytes 3.21585152E8
# HELP jvm_gc_pause_seconds Time spent in GC pause
# TYPE jvm_gc_pause_seconds summary
jvm_gc_pause_seconds_count{action="end of major GC",cause="Metadata GC Threshold",} 1.0
jvm_gc_pause_seconds_sum{action="end of major GC",cause="Metadata GC Threshold",} 0.047
jvm_gc_pause_seconds_count{action="end of major GC",cause="Allocation Failure",} 1.0
jvm_gc_pause_seconds_sum{action="end of major GC",cause="Allocation Failure",} 0.055
jvm_gc_pause_seconds_count{action="end of minor GC",cause="Allocation Failure",} 817.0
jvm_gc_pause_seconds_sum{action="end of minor GC",cause="Allocation Failure",} 2.041
# HELP jvm_gc_pause_seconds_max Time spent in GC pause
# TYPE jvm_gc_pause_seconds_max gauge
jvm_gc_pause_seconds_max{action="end of major GC",cause="Metadata GC Threshold",} 0.0
jvm_gc_pause_seconds_max{action="end of major GC",cause="Allocation Failure",} 0.0
jvm_gc_pause_seconds_max{action="end of minor GC",cause="Allocation Failure",} 0.002
# HELP jvm_threads_daemon_threads The current number of live daemon threads
# TYPE jvm_threads_daemon_threads gauge
jvm_threads_daemon_threads 16.0
# HELP process_files_open_files The open file descriptor count
# TYPE process_files_open_files gauge
process_files_open_files 26.0
# HELP jvm_buffer_total_capacity_bytes An estimate of the total capacity of the buffers in this pool
# TYPE jvm_buffer_total_capacity_bytes gauge
jvm_buffer_total_capacity_bytes{id="direct",} 81920.0
jvm_buffer_total_capacity_bytes{id="mapped",} 0.0
# HELP jvm_buffer_count_buffers An estimate of the number of buffers in the pool
# TYPE jvm_buffer_count_buffers gauge
jvm_buffer_count_buffers{id="direct",} 10.0
jvm_buffer_count_buffers{id="mapped",} 0.0
# HELP tomcat_sessions_alive_max_seconds
# TYPE tomcat_sessions_alive_max_seconds gauge
tomcat_sessions_alive_max_seconds 1860.0
# HELP jvm_threads_live_threads The current number of live threads including both daemon and non-daemon threads
# TYPE jvm_threads_live_threads gauge
jvm_threads_live_threads 20.0
# HELP jvm_gc_memory_promoted_bytes_total Count of positive increases in the size of the old generation memory pool before GC to after GC
# TYPE jvm_gc_memory_promoted_bytes_total counter
jvm_gc_memory_promoted_bytes_total 2.1599056E7
# HELP jvm_memory_used_bytes The amount of used memory
# TYPE jvm_memory_used_bytes gauge
jvm_memory_used_bytes{area="heap",id="Tenured Gen",} 2.110292E7
jvm_memory_used_bytes{area="heap",id="Eden Space",} 7854664.0
jvm_memory_used_bytes{area="nonheap",id="Metaspace",} 4.0416728E7
jvm_memory_used_bytes{area="nonheap",id="Code Cache",} 2.003616E7
jvm_memory_used_bytes{area="heap",id="Survivor Space",} 312536.0
jvm_memory_used_bytes{area="nonheap",id="Compressed Class Space",} 5070160.0
# HELP tomcat_sessions_rejected_sessions_total
# TYPE tomcat_sessions_rejected_sessions_total counter
tomcat_sessions_rejected_sessions_total 0.0
# HELP tomcat_sessions_active_current_sessions
# TYPE tomcat_sessions_active_current_sessions gauge
tomcat_sessions_active_current_sessions 364.0
# HELP system_cpu_usage The "recent cpu usage" for the whole system
# TYPE system_cpu_usage gauge
system_cpu_usage 0.06857142857142857
# HELP system_cpu_count The number of processors available to the Java virtual machine
# TYPE system_cpu_count gauge
system_cpu_count 1.0
# HELP jvm_gc_live_data_size_bytes Size of old generation memory pool after a full GC
# TYPE jvm_gc_live_data_size_bytes gauge
jvm_gc_live_data_size_bytes 1.2888032E7
# HELP process_cpu_usage The "recent cpu usage" for the Java Virtual Machine process
# TYPE process_cpu_usage gauge
process_cpu_usage 0.054285714285714284
# HELP tomcat_sessions_expired_sessions_total
# TYPE tomcat_sessions_expired_sessions_total counter
tomcat_sessions_expired_sessions_total 16954.0
# HELP jvm_threads_states_threads The current number of threads having NEW state
# TYPE jvm_threads_states_threads gauge
jvm_threads_states_threads{state="runnable",} 6.0
jvm_threads_states_threads{state="blocked",} 0.0
jvm_threads_states_threads{state="waiting",} 12.0
jvm_threads_states_threads{state="timed-waiting",} 2.0
jvm_threads_states_threads{state="new",} 0.0
jvm_threads_states_threads{state="terminated",} 0.0
# HELP tomcat_sessions_active_max_sessions
# TYPE tomcat_sessions_active_max_sessions gauge
tomcat_sessions_active_max_sessions 378.0
# HELP logback_events_total Number of error level events that made it to the logs
# TYPE logback_events_total counter
logback_events_total{level="warn",} 0.0
logback_events_total{level="debug",} 0.0
logback_events_total{level="error",} 0.0
logback_events_total{level="trace",} 0.0
logback_events_total{level="info",} 9.0
# HELP tomcat_sessions_created_sessions_total
# TYPE tomcat_sessions_created_sessions_total counter
tomcat_sessions_created_sessions_total 17318.0
# HELP process_start_time_seconds Start time of the process since unix epoch.
# TYPE process_start_time_seconds gauge
process_start_time_seconds 1.614153266981E9
# HELP system_load_average_1m The sum of the number of runnable entities queued to available processors and the number of runnable entities running on the available processors averaged over a period of time
# TYPE system_load_average_1m gauge
system_load_average_1m 0.0
5. Prometheus采集应用指标#
- 创建配置文件
# 创建文件夹/prometheus
cd /usr/local/
mkdir prometheus
# 创建配置文件
vi prometheus.yml
# 插入以下内容
scrape_configs:
- job_name: monitor-demo
scrape_interval: 5s
scrape_timeout: 5s
metrics_path: /actuator/prometheus
scheme: http
basic_auth:
username: admin
password: 123456
static_configs:
- targets:
- 192.168.0.100:8888
# 退出并保存
:wq
- Docker部署Prometheus
因为镜像来自外网,推荐查看博客:Docker 配置国内镜像源加速。
docker pull prom/prometheus
docker images
docker run --name=prometheus --privileged=true -p 9090:9090 -m 500M -v /usr/local/prometheus/prometheus.yml:/prometheus.yml -v /usr/local/prometheus/data:/data -d prom/prometheus --config.file=/prometheus.yml
docker ps
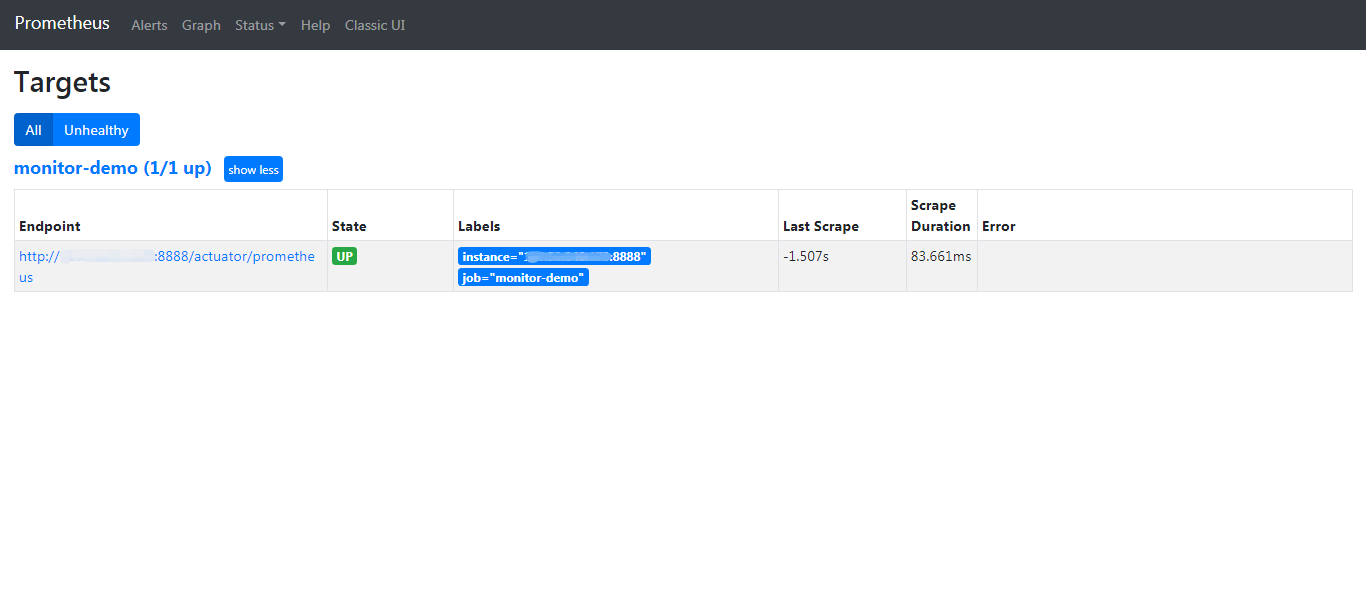
- 访问Prometheus
浏览器访问:http://192.168.0.100:9090/targets
6. Grafana可视化监控#
- Docker部署Grafana
因为镜像来自外网,推荐查看博客:Docker 配置国内镜像源加速。
docker pull grafana/grafana
docker images
docker run --name=grafana -p 3000:3000 -d grafana/grafana
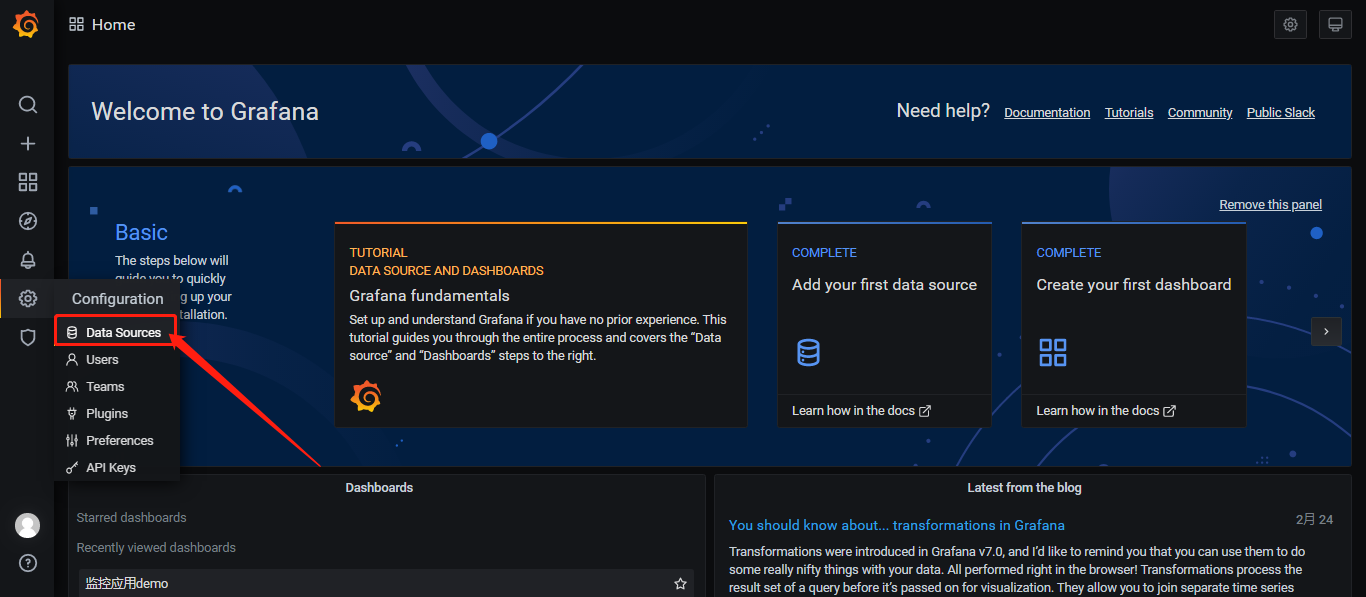
- 访问Grafana
浏览器访问:http://192.168.0.100:3000,输入用户名密码:admin/admin。

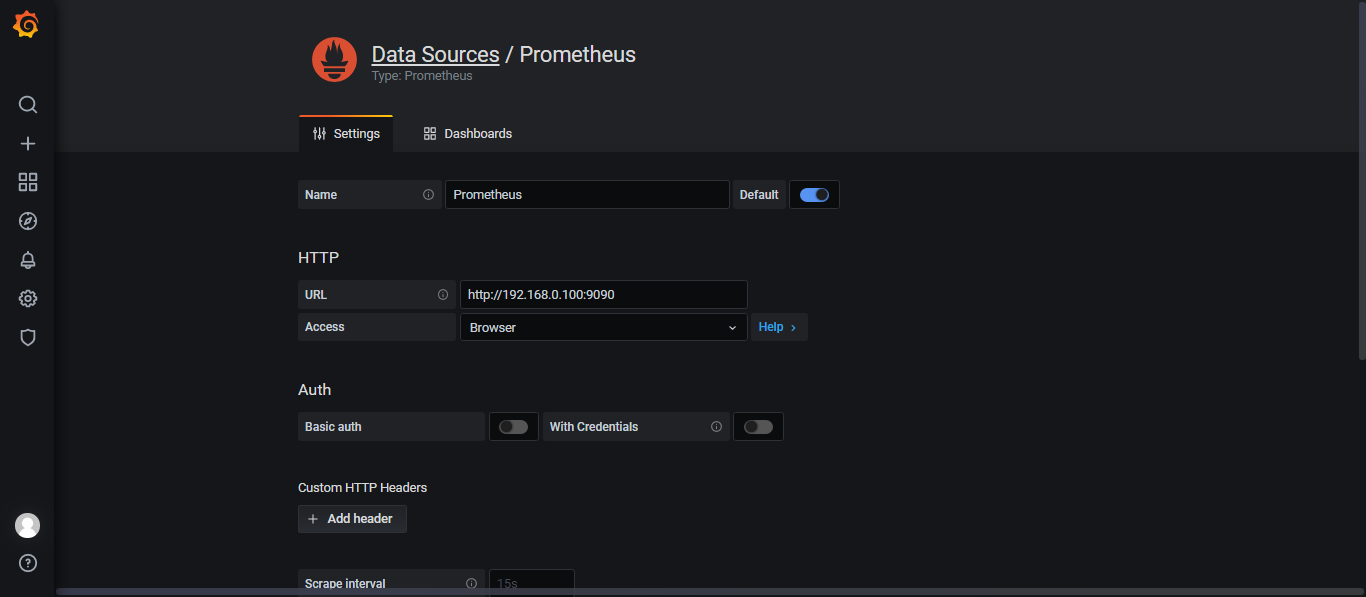
- 配置DataSource
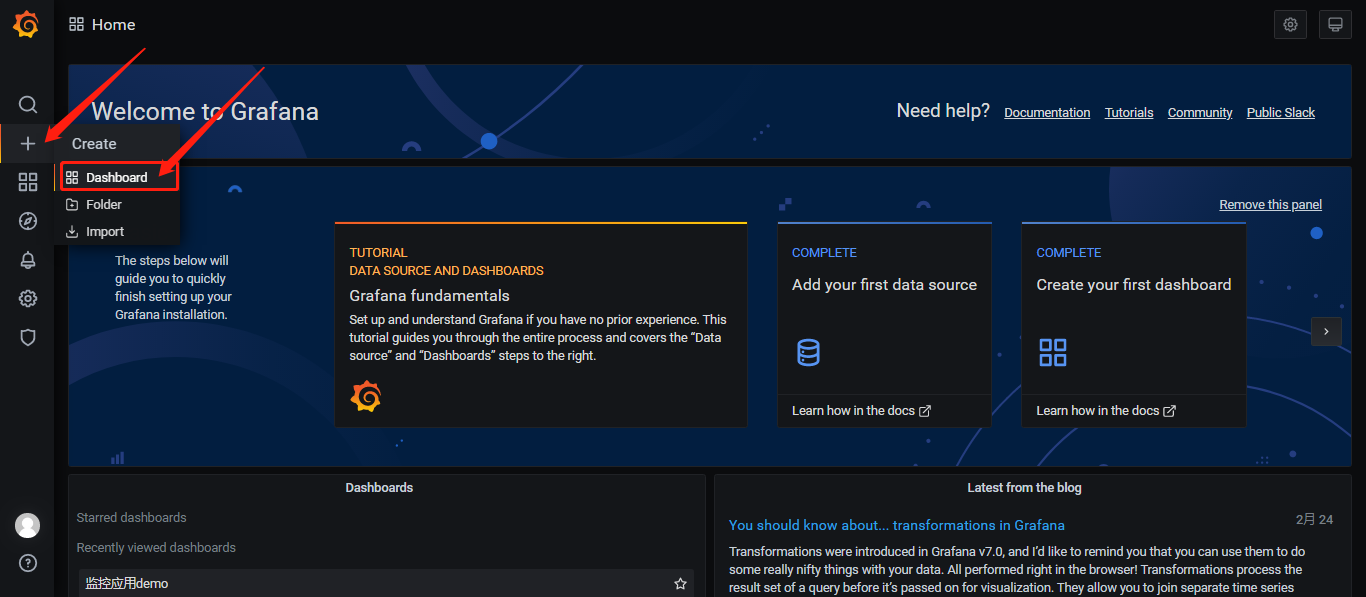
- 配置监控面板Dashboard
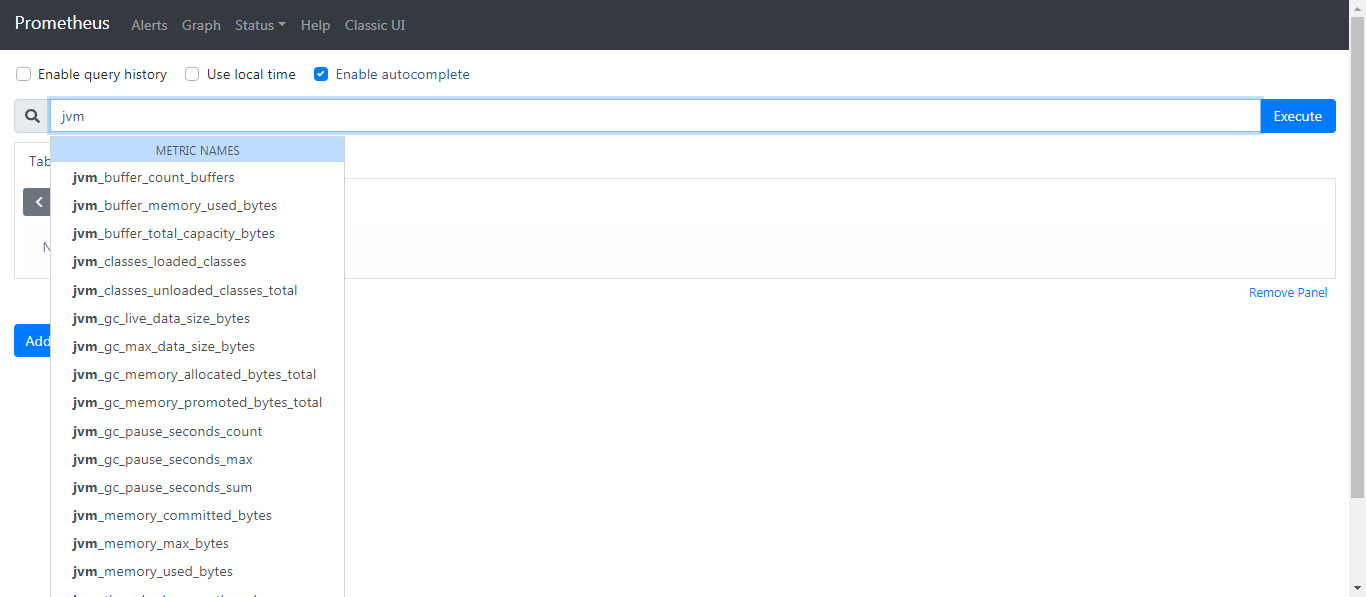
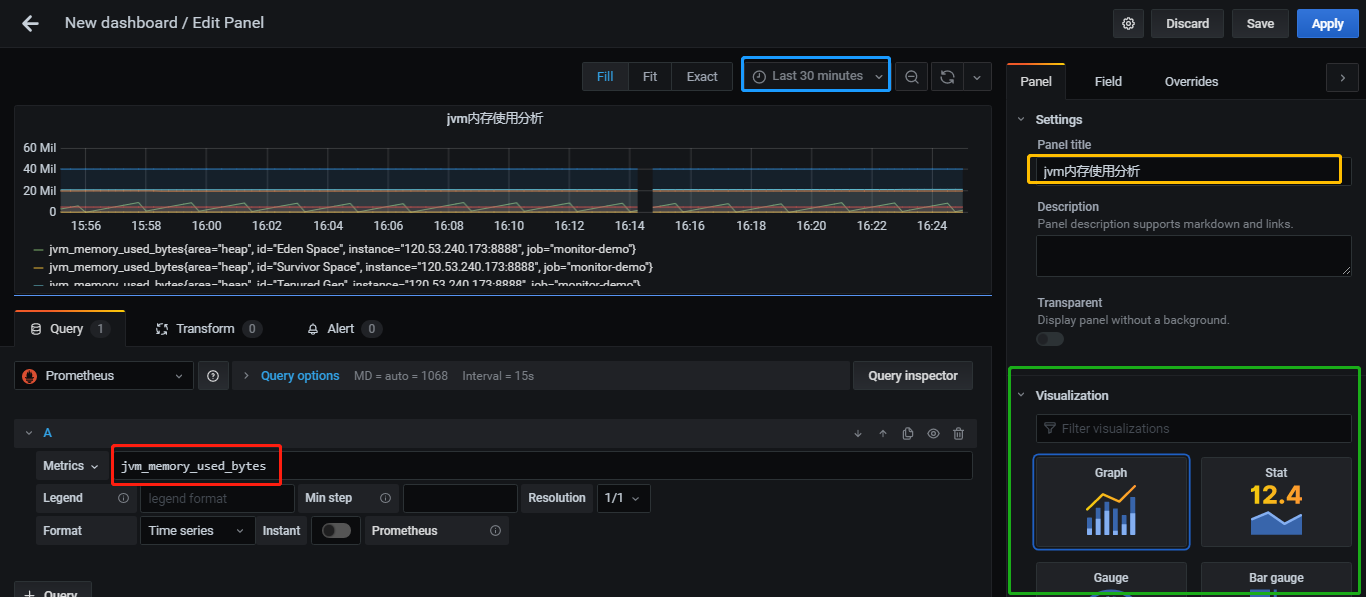
页面中可选择DataSource,可更改图标样式(Visualization),可配置多个指标(Metrics),指标值需要根据Prometheus中采集的指标填写,也可更改图标的时间区间。
浏览器访问:http://192.168.0.100:9090/graph查询采集的指标名称:
配置可视化面板:
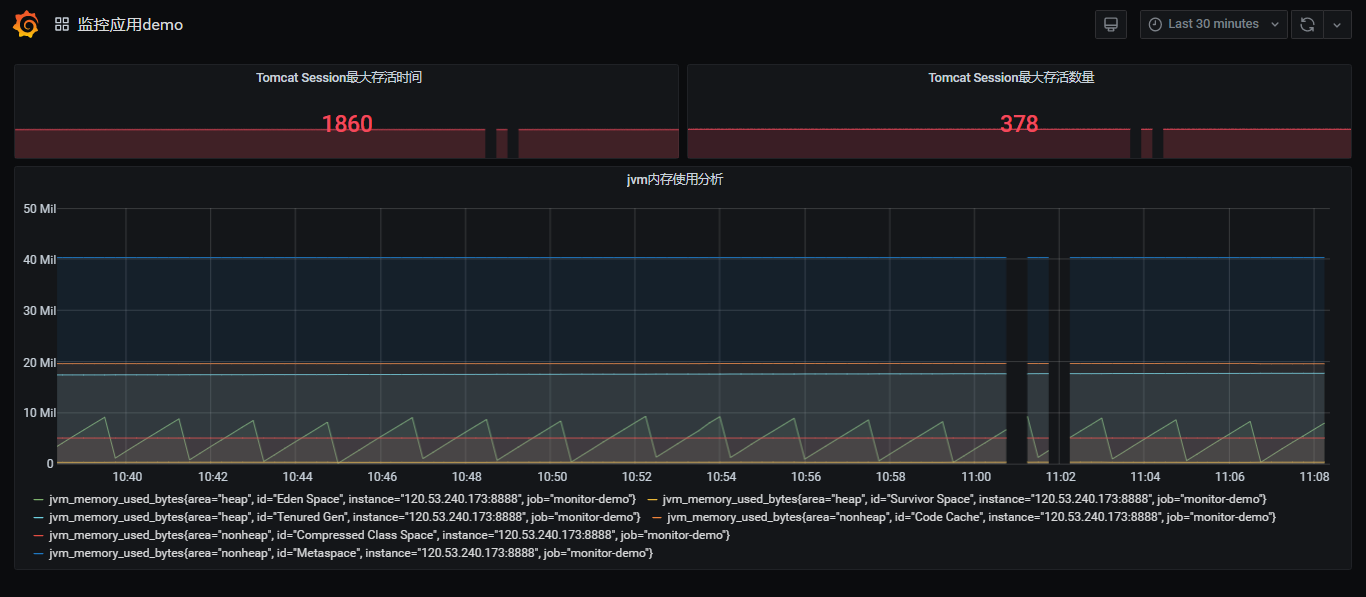
- 配置结果展示
- 补充
Grafana还支持自动告警,具体请自行查阅。


【推荐】国内首个AI IDE,深度理解中文开发场景,立即下载体验Trae
【推荐】编程新体验,更懂你的AI,立即体验豆包MarsCode编程助手
【推荐】抖音旗下AI助手豆包,你的智能百科全书,全免费不限次数
【推荐】轻量又高性能的 SSH 工具 IShell:AI 加持,快人一步
· AI与.NET技术实操系列:向量存储与相似性搜索在 .NET 中的实现
· 基于Microsoft.Extensions.AI核心库实现RAG应用
· Linux系列:如何用heaptrack跟踪.NET程序的非托管内存泄露
· 开发者必知的日志记录最佳实践
· SQL Server 2025 AI相关能力初探
· winform 绘制太阳,地球,月球 运作规律
· 震惊!C++程序真的从main开始吗?99%的程序员都答错了
· AI与.NET技术实操系列(五):向量存储与相似性搜索在 .NET 中的实现
· 超详细:普通电脑也行Windows部署deepseek R1训练数据并当服务器共享给他人
· 【硬核科普】Trae如何「偷看」你的代码?零基础破解AI编程运行原理