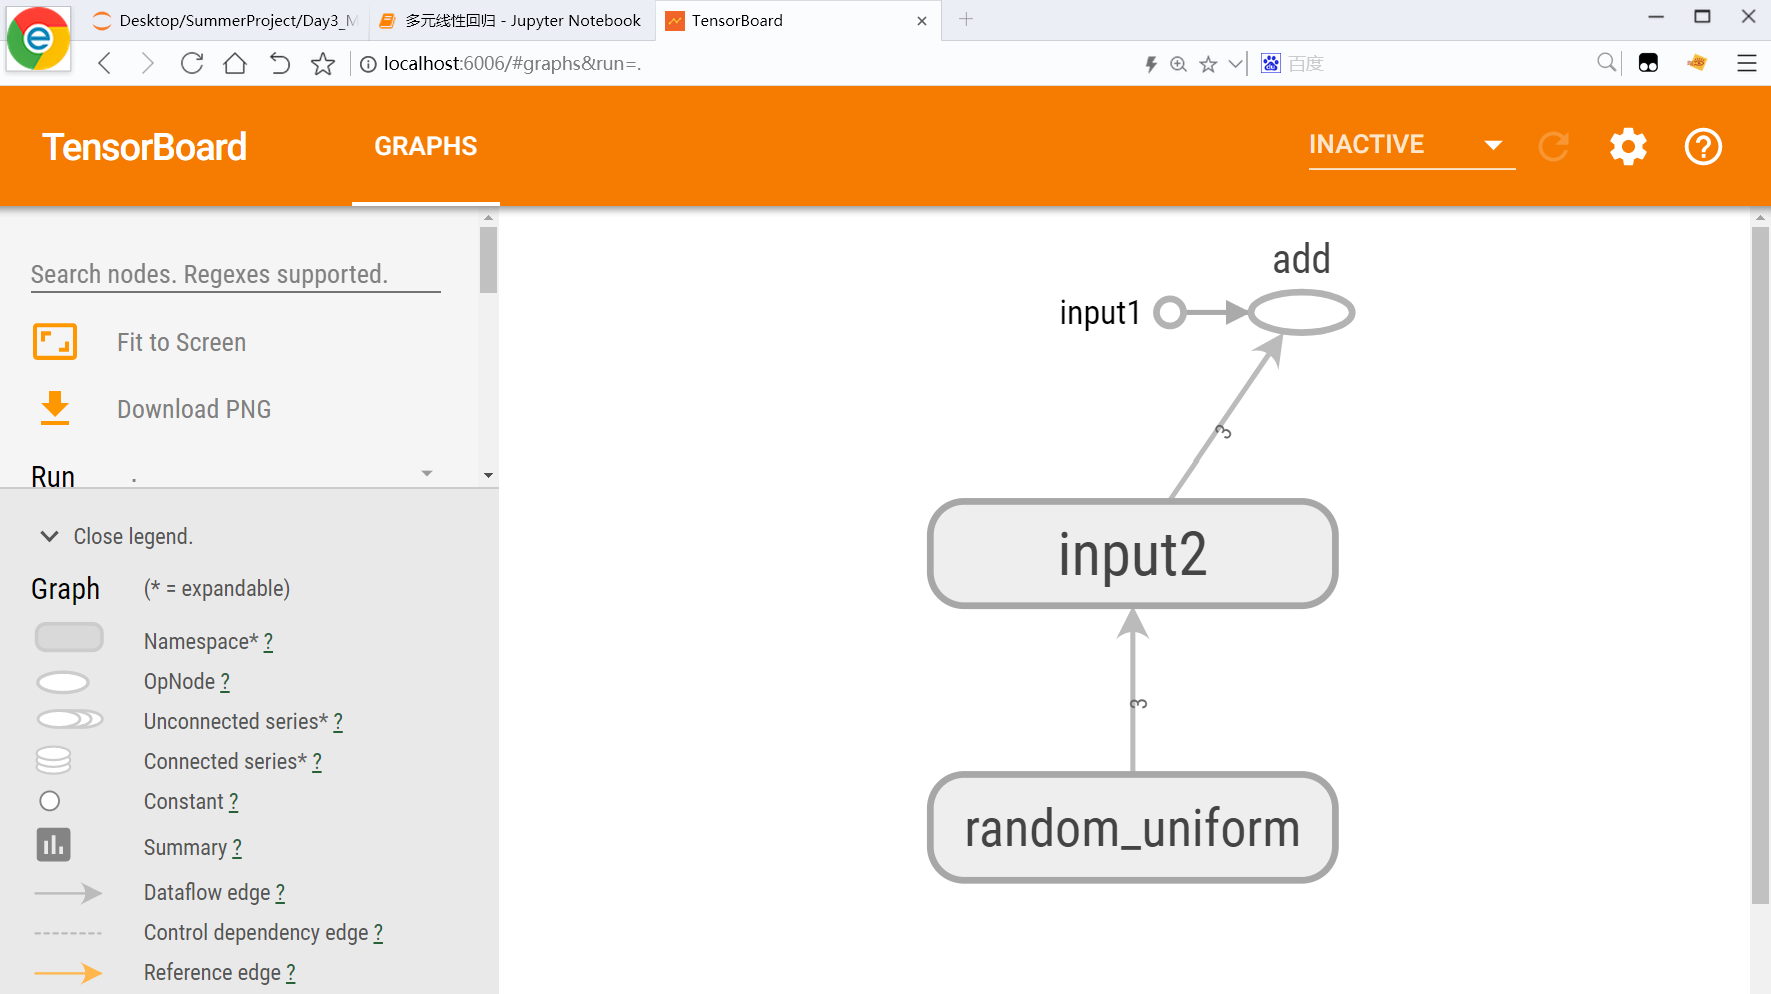
TeanorBoard可视化Tensorflow计算图步骤
或者显示No dashboards are active for the current data set.表示路径不对,不是计算图所在的文件夹,或者说没有生成日志文件。
1.写入一段代码
%matplotlib notebook

import tensorflow as tf
import matplotlib.pyplot as plt
import numpy as np
import pandas as pd
from sklearn.utils import shuffle
import os
os.environ["CUDA_VISIBLE_DEVICES"] = "-1"
print(tf.__version__)
print(tf.test.is_gpu_available())

# 定义一个简单的计算图,实现向量加法的操作。
input1 = tf.constant([1.0, 2.0, 3.0], name = 'input1')
input2 = tf.Variable(tf.random_uniform([3]), name = 'input2')
output = tf.add_n([input1, input2], name = 'add')

# 生成一个写日志的writer,并将当前的tensorflow计算图写入日志。
# tensorflow提供了多种写日志文件的API
writer = tf.summary.FileWriter('./logs', tf.get_default_graph())
writer.close()
2.查看当前文件夹下是否生成了文件
文件夹命名不要中文!不要带空格!

2.打开终端输入tensorboard --logdir=路径
本例中输入的是:tensorboard --logdir=C:\Users\28746\Desktop\SummerProject\Day3_MLR\logs

3.在浏览器中打开localhost:6006


