Kaggle-data-cleaning(2)
Scaling-and-normalization
教程
Scaling vs. Normalization: What's the difference?
容易在缩放(Scaling)和规范化(Normalization)之间混淆的原因之一是,这些术语有时可以互换使用,并且使它们更加混乱,它们非常相似! 在这两种情况下,都将转换数字变量的值,以便转换后的数据点具有特定的有用属性。 区别在于:
在扩展(Scaling)时,您正在更改数据范围,而在规范化(Normalization)中,您正在更改数据分布的形状。
让我们更深入地讨论这些选项。
Scaling
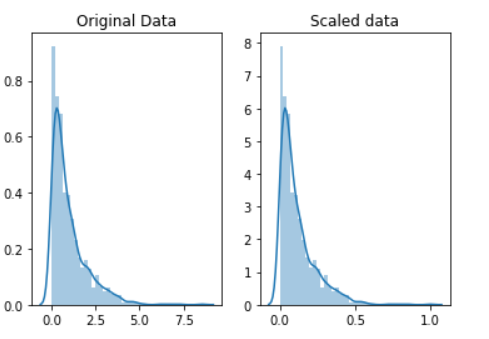
这种方法意味着您正在转换数据,使其适合特定范围,例如将其转化到0-100或0-1上。 当您使用基于数据点相距的度量的方法来缩放数据时,例如支持向量机(SVM)或k近邻(KNN)。 使用这些算法,任何数字特征中的更改都具有相同的重要性。但是实际情况每个特征的重要性是不同的,所以要进行缩放,相当于权重的表现
例如,您可能正在查看某些产品的日元和美元价格。 一美元约值100日元,但是,如果您不按比例调整价格,则SVM或KNN之类的方法将把1日元的价格差异与1美元的价格一样重要! 这显然不符合我们对世界的直觉。 使用货币,您可以在货币之间进行转换。 但是,如果您要看的是身高和体重,该怎么办? 尚不清楚一磅等于多少磅(或一米等于多少公斤)。
通过缩放变量,可以帮助您平等地比较不同的变量。
使用如下方法可以进行放缩
scaled_data = minmax_scaling(original_data, columns=[0])
Normalization
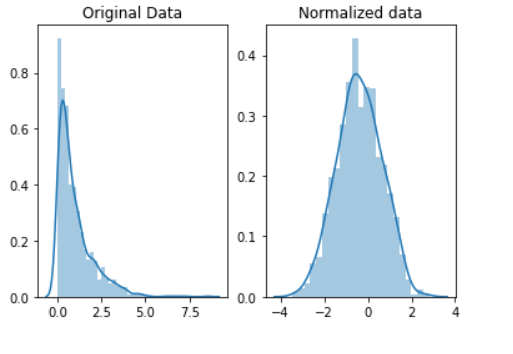
扩展只会改变数据范围。 规范化是一种更根本的转变。 规范化的目的是更改您的观察结果,以便可以将它们描述为正态分布。
(ps:正态分布:也称为“钟形曲线”,这是一种特定的统计分布,其中大致相等的观察值落在均值上下,均值和中位数相同,并且更多的观察值更接近均值。 正态分布也称为高斯分布。)
通常,仅当您要使用假设数据呈正态分布的机器学习或统计技术时,才需要对数据进行标准化。 其中的一些示例包括t检验,方差分析,线性回归,线性判别分析(LDA)和高斯朴素贝叶斯。 (专家提示:名称中带有“高斯”的任何方法都可能假设是正常的。)
我们这里用来规范化的方法称为Box-Cox变换。 让我们快速看一下规范化某些数据的样子:
# normalize the exponential data with boxcox
normalized_data = stats.boxcox(original_data)

# plot both together to compare
fig, ax=plt.subplots(1,2)
sns.distplot(original_data, ax=ax[0])
ax[0].set_title("Original Data")
sns.distplot(normalized_data[0], ax=ax[1])
ax[1].set_title("Normalized data")
1) Practice scaling
We just scaled the "usd_goal_real" column. What about the "goal" column?
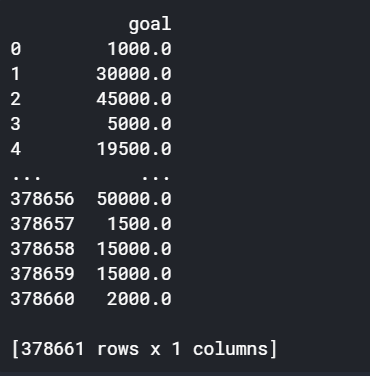
Begin by running the code cell below to create a DataFrame original_goal_data containing the "goal" column.
# select the usd_goal_real column
original_goal_data = pd.DataFrame(kickstarters_2017.goal)
print(original_goal_data)
Use original_goal_data to create a new DataFrame scaled_goal_data with values scaled between 0 and 1. You must use the minimax_scaling() function.
# TODO: Your code here
scaled_goal_data = minmax_scaling(original_goal_data,columns=["goal"])

# Check your answer
q1.check()
练习
1) Practice scaling
We just scaled the "usd_goal_real" column. What about the "goal" column?
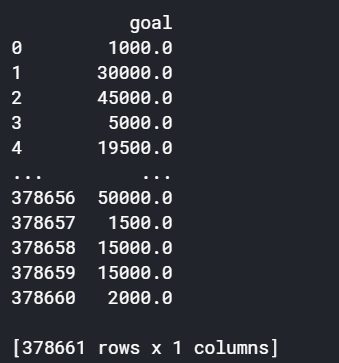
Begin by running the code cell below to create a DataFrame original_goal_data containing the "goal" column.
# select the usd_goal_real column
original_goal_data = pd.DataFrame(kickstarters_2017.goal)
print(original_goal_data)
Use original_goal_data to create a new DataFrame scaled_goal_data with values scaled between 0 and 1. You must use the minimax_scaling() function.
# TODO: Your code here
scaled_goal_data = minmax_scaling(original_goal_data,columns=["goal"])

# Check your answer
q1.check()
2) Practice normalization
We used the "usd_pledged_real" column. Follow the same process to normalize the "pledged" column.
You want to build a linear regression model to predict someone's grades given how much time they spend on various activities during a normal school week. You notice that your measurements for how much time students spend studying aren't normally distributed: some students spend almost no time studying and others study for four or more hours every day. Should you scale or normalize this variable?
You're still working on your grades study, but you want to include information on how students perform on several fitness tests as well. You have information on how many jumping jacks and push-ups each student can complete in a minute. However, you notice that students perform far more jumping jacks than push-ups: the average for the former is 40, and for the latter only 10. Should you scale or normalize these variables?
Once you have an answer, run the code cell below.
# TODO: Your code here!
# normalized_pledges = pd.Series(stats.boxcox(positive_pledges)[0],
#                                name='pledged', index=positive_pledges.index)
index_positive_pledges = kickstarters_2017.pledged > 0

# get only positive pledges (using their indexes)
positive_pledges_only = kickstarters_2017.pledged.loc[index_positive_pledges]

# normalize the pledges (w/ Box-Cox)
normalized_values = pd.Series(stats.boxcox(positive_pledges_only)[0],
                              name='pledged', index=positive_pledges_only.index)

# plot both together to compare
fig, ax = plt.subplots(1,2,figsize=(15,3))
sns.distplot(positive_pledges_only, ax=ax[0])
ax[0].set_title("Original Data")
sns.distplot(normalized_values, ax=ax[1])
ax[1].set_title("Normalized data")
3) Normalization or scaling?
For each of the following examples, decide whether scaling or normalization makes more sense.
1.You want to build a linear regression model to predict someone's grades given how much time they spend on various activities during a normal school week. You notice that your measurements for how much time students spend studying aren't normally distributed: some students spend almost no time studying and others study for four or more hours every day. Should you scale or normalize this variable?
2.You're still working on your grades study, but you want to include information on how students perform on several fitness tests as well. You have information on how many jumping jacks and push-ups each student can complete in a minute. However, you notice that students perform far more jumping jacks than push-ups: the average for the former is 40, and for the latter only 10. Should you scale or normalize these variables?
-->
在第一个示例中,归一化是有意义的,因为线性回归将假设数据呈正态分布。 在第二个示例中,缩放是有意义的,因此我们可以比较在相等的立足点上跳跃起重器和俯卧撑的差异。
