Kaggle-geospatial-analysis(1)
Your-first-map
教程
在本微型课程中,您将学习处理和可视化地理空间数据或具有地理位置的数据的不同方法。
在此过程中,您将为一些实际问题提供解决方案,例如:
全球非营利组织应在哪里扩大在菲律宾偏远地区的影响力?
濒临灭绝的鸟类紫色马丁在北美和南美之间如何旅行? 鸟类正在前往保护区吗?
日本哪些地区可能会从额外的地震加固中受益?
加利福尼亚州的哪些星巴克商店是下一个星巴克储备烘焙店的理想选择?
纽约市是否有足够的医院应对机动车碰撞? 这个城市的哪些地区覆盖范围不足?
在第一个教程中,我们将快速介绍完成此微型课程所需的先决条件。 而且,如果您想更深入地复习,我们建议您使用Pandas微课程。
我们还将开始可视化我们的第一个地理空间数据集
Reading data
第一步是读取一些地理空间数据! 为此,我们将使用GeoPandas库。
import geopandas as gpd
有许多不同的地理空间文件格式,例如shapefile,GeoJSON,KML和GPKG。 我们不会在此微型课程中讨论它们的差异,但重要的是要提到:
shapefile是您将遇到的最常见的文件类型,并且所有这些文件类型都可以使用gpd.read_file()函数快速加载。
下一个代码单元加载一个shapefile,其中包含有关森林,荒野地区和其他土地的信息,这些信息由纽约州环境保护部负责。
Prerequisites
要查看数据的前五行,我们使用了head()方法。 您可能还记得,这也是我们用来预览Pandas DataFrame的工具。 实际上,可以与DataFrame一起使用的每个命令都可以处理数据!
这是因为数据已加载到具有(Pandas)DataFrame所有功能的(GeoPandas)GeoDataFrame对象中。
Create your first map!
我们可以使用plot()方法快速查看数据
wild_lands.plot()
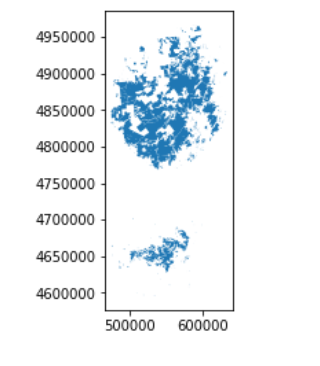
每个GeoDataFrame都包含一个特殊的“几何”列。 它包含我们调用plot()方法时显示的所有几何对象
# View the first five entries in the "geometry" column
wild_lands.geometry.head()
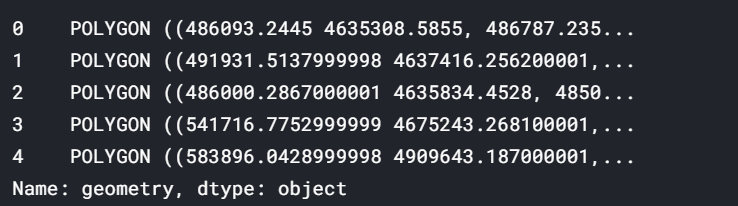
尽管此列可以包含各种不同的数据类型,但每个条目通常将是Point,LineString或Polygon。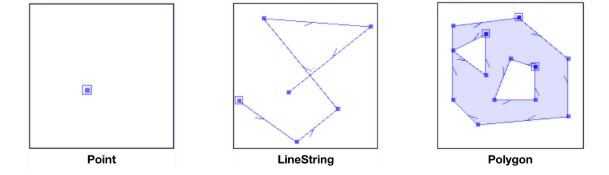
数据集中的“几何”列包含2983个不同的多边形对象,每个对象对应于上图中的不同形状。
在下面的代码单元中,我们再创建三个GeoDataFrame,其中包含营地位置(Point),路线(LineString)和边界(Polygon)。
# Campsites in New York state (Point)
POI_data = gpd.read_file("../input/geospatial-learn-course-data/DEC_pointsinterest/DEC_pointsinterest/Decptsofinterest.shp")
campsites = POI_data.loc[POI_data.ASSET=='PRIMITIVE CAMPSITE'].copy()

# Foot trails in New York state (LineString)
roads_trails = gpd.read_file("../input/geospatial-learn-course-data/DEC_roadstrails/DEC_roadstrails/Decroadstrails.shp")
trails = roads_trails.loc[roads_trails.ASSET=='FOOT TRAIL'].copy()

# County boundaries in New York state (Polygon)
counties = gpd.read_file("../input/geospatial-learn-course-data/NY_county_boundaries/NY_county_boundaries/NY_county_boundaries.shp")
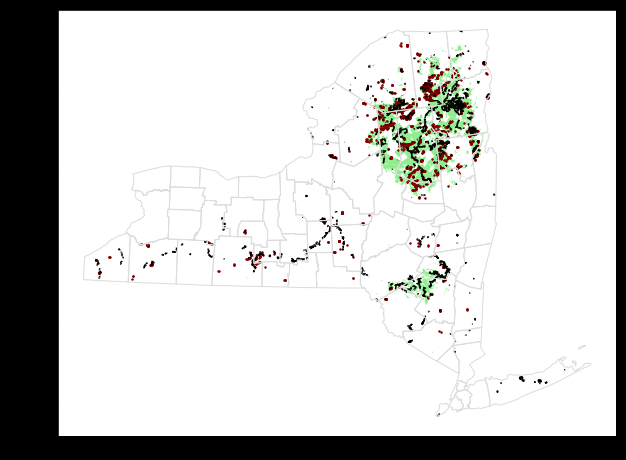
接下来,我们从所有四个GeoDataFrames创建一个地图。
plot()方法采用(可选)输入几个可用于自定义外观的参数。 最重要的是,为ax设置一个值可确保所有信息都绘制在同一张地图上。
# Define a base map with county boundaries
ax = counties.plot(figsize=(10,10), color='none', edgecolor='gainsboro', zorder=3)

# Add wild lands, campsites, and foot trails to the base map
wild_lands.plot(color='lightgreen', ax=ax)
campsites.plot(color='maroon', markersize=2, ax=ax)
trails.plot(color='black', markersize=1, ax=ax)
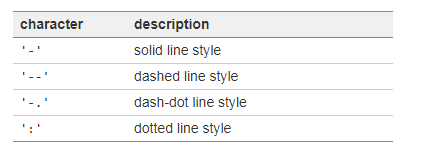
markersize代表点的大小
练习
1) Get the data.
Use the next cell to load the shapefile located at loans_filepath to create a GeoDataFrame world_loans.
loans_filepath = "../input/geospatial-learn-course-data/kiva_loans/kiva_loans/kiva_loans.shp"

# Your code here: Load the data
world_loans = gpd.read_file(loans_filepath)

# Check your answer
q_1.check()

# Uncomment to view the first five rows of the data
world_loans.head()
2) Plot the data.
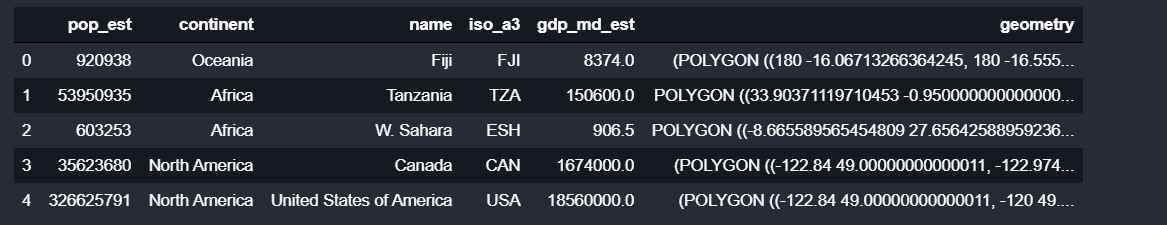
Run the next code cell without changes to load a GeoDataFrame world containing country boundaries.
# This dataset is provided in GeoPandas
world_filepath = gpd.datasets.get_path('naturalearth_lowres')
world = gpd.read_file(world_filepath)
world.head()
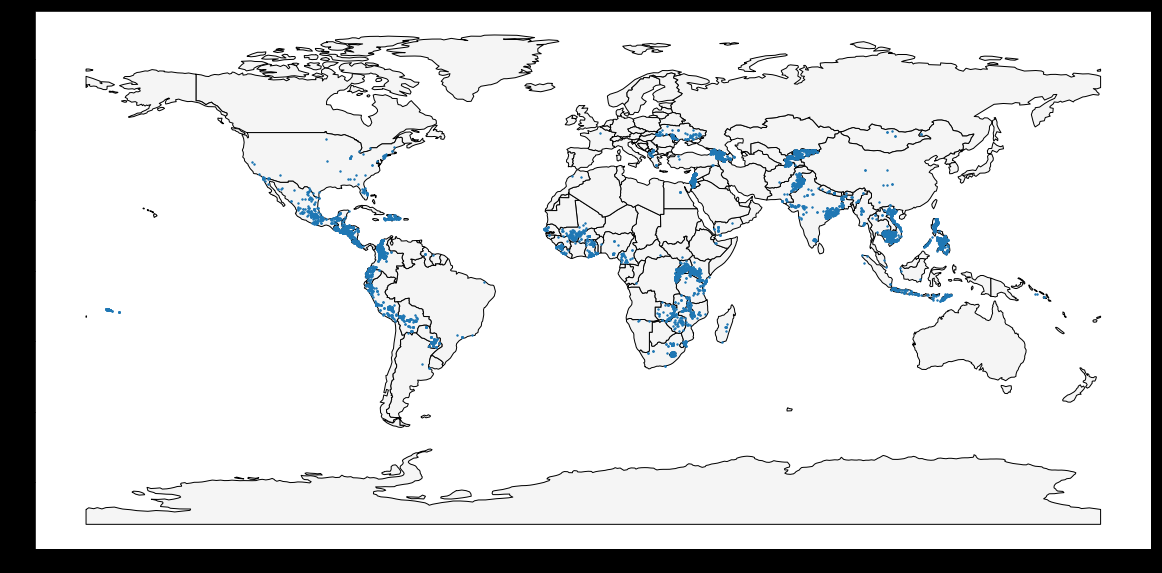
Use the world and world_loans GeoDataFrames to visualize Kiva loan locations across the world.
ax = world.plot(figsize=(20,20), color='whitesmoke', linestyle='-', edgecolor='black')
world_loans.plot(ax=ax, markersize=2)
# Uncomment to see a hint
q_2.hint()
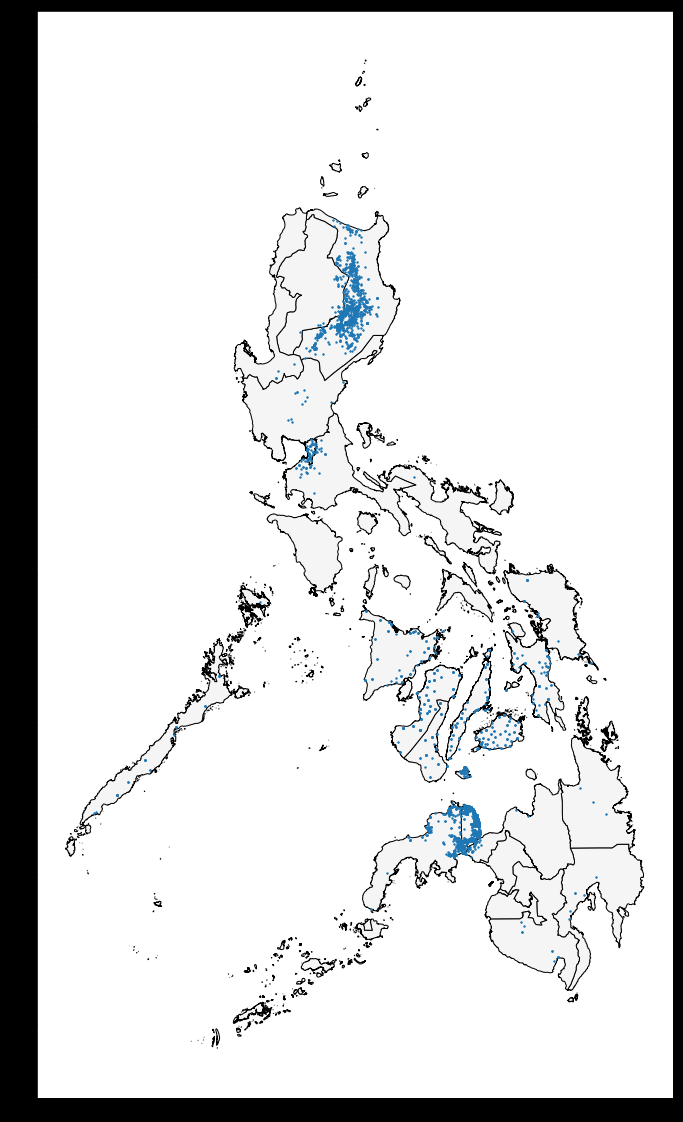
3) Select loans based in the Philippines.
Next, you'll focus on loans that are based in the Philippines. Use the next code cell to create a GeoDataFrame PHL_loans which contains all rows from world_loans with loans that are based in the Philippines.
# Your code here
PHL_loans = world_loans.loc[world_loans.country=="Philippines"].copy()

# Check your answer
q_3.check()
4) Understand loans in the Philippines.
Run the next code cell without changes to load a GeoDataFrame PHL containing boundaries for all islands in the Philippines.
# Your code here
ax = PHL.plot(figsize=(20,20), color='whitesmoke', linestyle='-', edgecolor='black')
PHL_loans.plot(ax=ax, markersize=2)

# Uncomment to see a hint
#q_4.a.hint()