[Python]Matplotlib绘图基础
1.简介
Matplotlib 是一个 Python 的 2D绘图库,它以各种硬拷贝格式和跨平台的交互式环境生成出版质量级别的图形。
2.绘图基础
2.1 图表基本元素
- 图例和标题
- x轴和y轴、刻度、刻度标签
- 绘图区域及边框
- 网格线
2.2 图表基本属性
- 多重绘图属性: 是否在同一个图上绘制多个系列的线
- 多重子图属性: 是否生成多个子图,并在每个子图上绘制多个系列的线
3.绘图方式
3.1 Pyplot API[1]
3.1.1 属性设置函数
- 绘制图边框: box
- 为图表添加图例: figlegend
- 为轴系列添加图例:legend
- 为图添加标题:title
- 在图上添加文字: figtext
- 在轴系列上添加文字:text
- 设置网格: grid
- 设置多重绘图:hold
- 使用紧密布局:tight_layout
- 改变刻度和刻度标签的样式:tick_params / ticklabel_format
- 设置最小刻度:minorticks_off / minorticks_on
- 在多个子图上方绘制超级标题:suptitle
- 为图表添加数据表:table
- 共享x轴或y轴:twinx / twiny
- 设置x/y标签:xlabel / ylabel
- 设置x/y极限:xlim / ylim
- 设置x/y刻度:xticks / yticks
3.1.2 属性获取函数
- 获取系列轴:gca
- 获取图表:gcf
- 获取图表标签:get_figlabels
- 获取图表数目:get_fignums
3.1.3 辅助线函数
- 水平竖直线:axhline / axvline
- 水平竖直域:axhspan / axvspan
- 误差棒:errorbar
- 竖直线:vlines
3.1.4 绘图函数
- 条形图:bar / barh / broken_barh
- 箱线图:boxplot
- 六边形图:hexbin
- 直方图:hist / hist2d
- 矩阵图:matshow
- 饼状图:pie
- 颜色棒图:colorbar
- 极坐标图:polar
- 散点图:scatter
- 树干图:stem
- 阶梯图:step
- 对数图:loglog / semilogx / semilogy
- 小提琴图:violinplot
- 重新绘制:draw
- 生成一个新的图:figure
- 生成子图:subplot / subplots
- 填充区域: fill / fill_between / fill_betweenx
- 在轴系列上绘制线或者标记:plot
- 绘制时间数据:plot_date
- 显示图表:show
3.1.5 清除函数
- 清除特定系列的轴对象: cla
- 从当前图中清除特定系列的轴对象:delaxes
- 清除当前图:clf
- 关闭图窗口:close
- 保存图表:savefig
3.2 Object-Oriented API[2]
Axes类
将pyplot API封装成对象的成员函数,建议使用这些成员函数,更加利于理解绘图过程
4.Example
import re import numpy as np import matplotlib.pyplot as plt def extract_time(filename): handle = open(filename) handle.readline() handle.readline() handle.readline() line = handle.readline() all_time = [] while line: cqe_time_stamp_tuple = re.findall(r'\d+', line) all_time.append(int(cqe_time_stamp_tuple[-1])) line = handle.readline() all_time.sort() return all_time
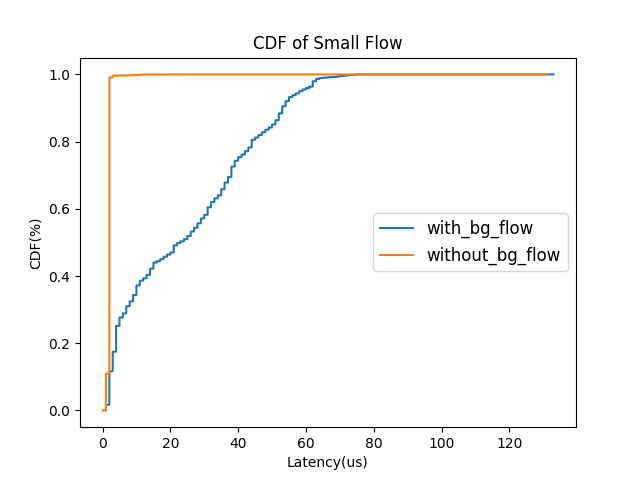
def heterogeneous_plot(h_time, i_time): pct_axis = 1. * np.arange(len(h_time)) / (len(h_time) - 1)
#绘制第一条线并设置图例 plt.plot(h_time, pct_axis, label="with_bg_flow")
#绘制第二条线并设置图例 plt.plot(i_time, pct_axis, label="without_bg_flow")
#设置图例显示属性 plt.legend(loc='center right', fontsize='large')
#设置图表标题 plt.title("CDF of Small Flow")
#设置x/y轴标题 plt.xlabel("Latency(us)") plt.ylabel("CDF(%)") plt.show() if __name__ == "__main__": h_time_data = extract_time("1_tmp_data/100000_OUTPUT") i_time_data = extract_time("2_tmp_data/100000_OUTPUT") heterogeneous_plot(h_time_data, i_time_data) individual_plot(h_time_data, i_time_data)
5.参考资料:
[1] matplot.pyplot api documents[https://matplotlib.org/api/pyplot_summary.html]
[2] matplot.axes[https://matplotlib.org/api/axes_api.html#matplotlib.axes.Axes]
Happy Ending Every Day

 浙公网安备 33010602011771号