下载数据(matplotlib可视化16章-1)
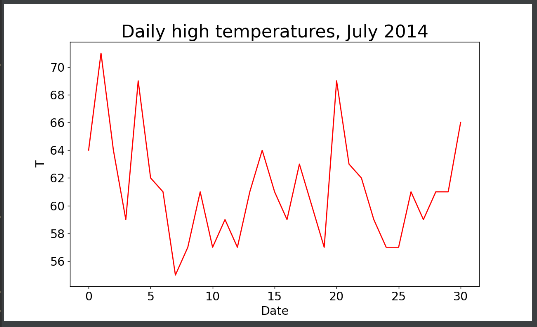
1、从CSV文件中提取数据
import csv

import matplotlib.pyplot as plt

filename = 'sitka_weather_07-2014.csv'
with open(filename) as f:
    reader = csv.reader(f)
    header_row = next(reader)

    #  #打印头文件
    # print(header_row)
    #
    # #打印头文件及其位置
    # for index, column_header in enumerate(header_row):
    #     print(index, column_header)

    #提取最高气温
    highs = []
    for row in reader:
        high = int(row[1])
        highs.append(high)
    print(highs)


    fig = plt.figure(dpi=128,figsize=(10,6))
    plt.plot(highs, c='red')

    plt.title("Daily high temperatures, July 2014", fontsize=24)
    plt.xlabel("Date",fontsize=16)
    plt.ylabel("T",fontsize=16)
    plt.tick_params(axis="both",which='major',labelsize=16)
    plt.show()
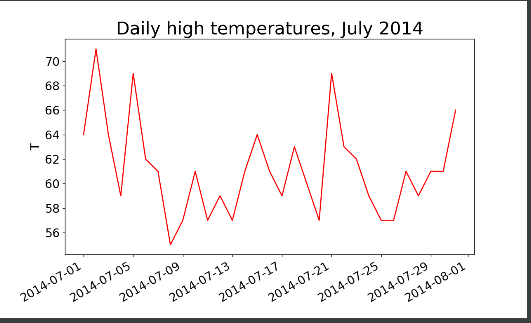
2、datetime模块
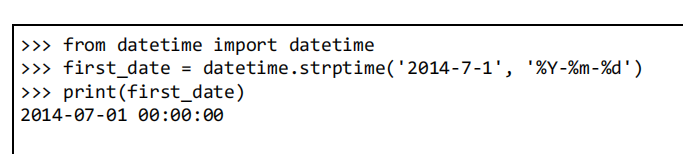

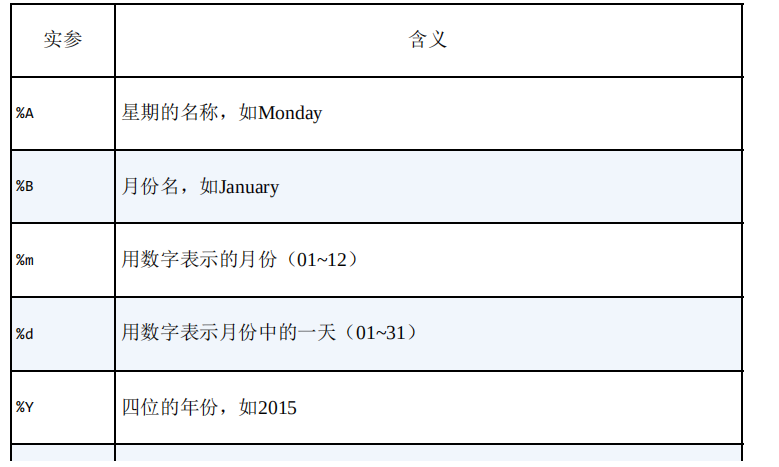
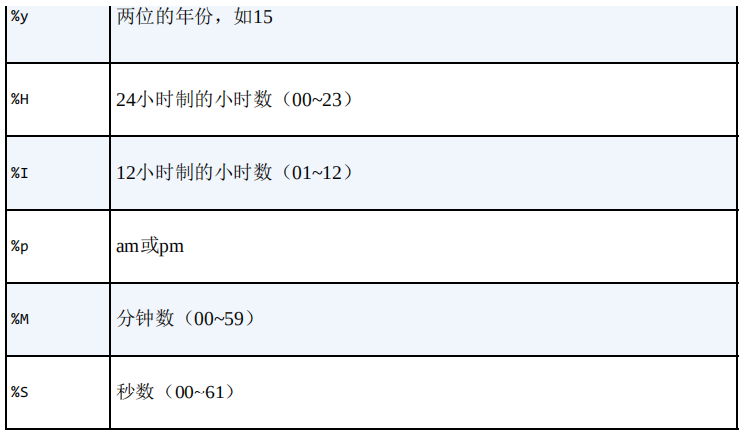
import csv
import matplotlib.pyplot as plt
from datetime import datetime

filename = 'sitka_weather_07-2014.csv'
with open(filename) as f:
    reader = csv.reader(f)
    header_row = next(reader)

    #提取最高气温和日期
    highs = []
    dates = []
    for row in reader:
        high = int(row[1])
        highs.append(high)
        date =datetime.strptime(row[0], "%Y-%m-%d")
        dates.append(date)
    # print(dates)

    fig = plt.figure(dpi=128,figsize=(10,6))
    plt.plot(dates,highs, c='red')

    plt.title("Daily high temperatures, July 2014", fontsize=24)
    plt.xlabel(" ",fontsize=16)
    fig.autofmt_xdate()
    plt.ylabel("T",fontsize=16)
    plt.tick_params(axis="both",which='major',labelsize=16)
    plt.show()
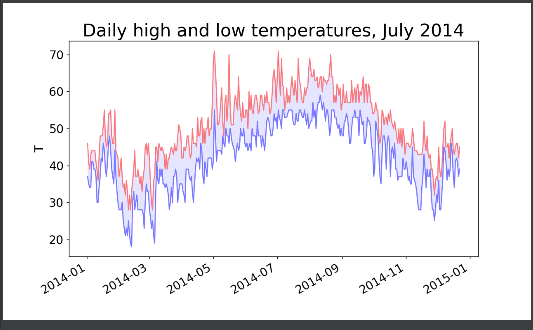
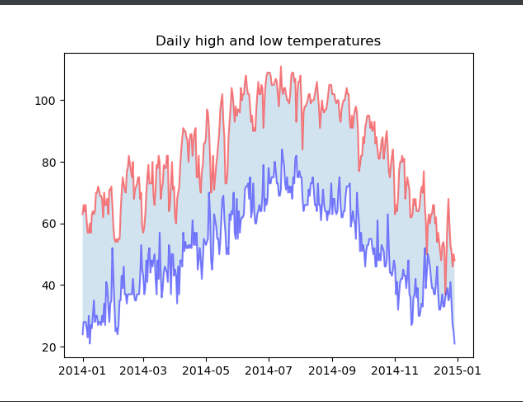
3、错误处理
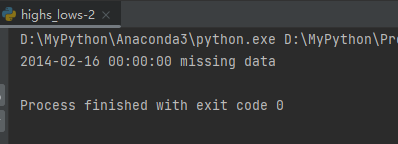
当文件中缺少一些数据时,使用异常处理来解决问题。
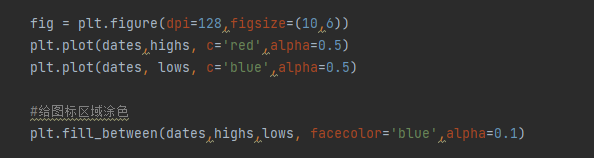
import csv
from datetime import datetime

import matplotlib.pyplot as plt

filename='death_valley_2014.csv'

with open(filename) as f:
    reader = csv.reader(f)
    header = next(reader)

    highs = []
    lows =[]
    dates = []

    for row in reader:
        try:
            date = datetime.strptime(row[0],"%Y-%m-%d")
            high = int(row[1])
            low = int(row[3])
        except ValueError:
            print(date, 'missing data')
        else:
            highs.append(high)
            lows.append(low)
            dates.append(date)

    plt.plot(dates,highs,c='red',alpha=0.5)
    plt.plot(dates,lows,c='blue',alpha=0.5)
    plt.fill_between(dates,highs,lows,alpha=0.2)
    plt.title("Daily high and low temperatures")


    plt.show()

 浙公网安备 33010602011771号