
h5 canvas基于数据的可视化统计图
基于面向对象的方式可视化数据:
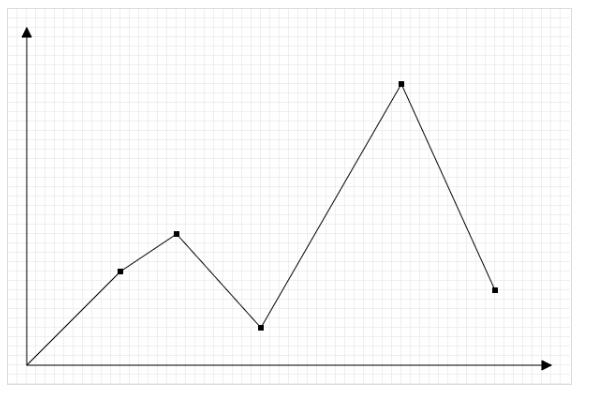
(1)折现统计图:
1 效果图:
2.具体代码:
<!DOCTYPE html>
<html lang="en">
<head>
    <meta charset="UTF-8">
    <title>面向对象的思维绘制折线图</title>
    <style>
        canvas {
            border: 1px solid #dddddd;
            display: block;
            margin: 50px auto 0;
        }
    </style>
</head>
<body>
<canvas height="400" width="600"></canvas>

<script>
    //构造函数
    var LineChart = function (ctx) {
        //获取绘图工具
        this.ctx = ctx || document.querySelector('canvas').getContext('2d');
        //获取画布大小
        this.canvasWidth = this.ctx.canvas.width;
        this.canvasHeight = this.ctx.canvas.height;
        //网格大小
        this.gridSzie = 10;
        //坐标系间距
        this.space = 20;
        //箭头大小
        this.arrowSize = 10;
        //点大小
        this.dottedSize = 6;
        //坐标系原点
        this.x0 = this.space;
        this.y0 = this.canvasHeight - this.space;
    };
    //添加原型方法
    LineChart.prototype.init = function (data) {
        this.drawGrid();
        this.drawCoordinate();
        this.drawDotted(data);
    };
    //绘制网格方法
    LineChart.prototype.drawGrid = function () {
        //开启一个新的轨迹
        this.ctx.beginPath();
        this.ctx.strokeStyle = '#eee';
        //X方向的线
        var xLineTotal = this.canvasWidth / this.gridSzie;
        for (var i = 0; i < xLineTotal; i++) {
            this.ctx.moveTo(0, i * this.gridSzie - 0.5);
            this.ctx.lineTo(this.canvasWidth, i * this.gridSzie - 0.5);
            this.ctx.stroke();
        }
        //y方向的线
        var yLineTotal = this.canvasHeight / this.gridSzie;
        for (var i = 0; i < xLineTotal; i++) {
            this.ctx.moveTo(i * this.gridSzie - 0.5, 0);
            this.ctx.lineTo(i * this.gridSzie - 0.5, this.canvasHeight);
            this.ctx.stroke();

        }

    };
    //绘制坐标系
    LineChart.prototype.drawCoordinate = function () {

        //绘制x轴坐标系
        this.ctx.beginPath();
        this.ctx.strokeStyle = '#000';
        this.ctx.moveTo(this.x0, this.y0);
        this.ctx.lineTo(this.canvasWidth - this.space, this.y0);
        this.ctx.lineTo(this.canvasWidth - this.space - this.arrowSize, this.y0 + this.arrowSize / 2);
        this.ctx.lineTo(this.canvasWidth - this.space - this.arrowSize, this.y0 - this.arrowSize / 2);
        this.ctx.lineTo(this.canvasWidth - this.space, this.y0);
        this.ctx.stroke();
        this.ctx.fill();

        //绘制Y轴坐标系
        this.ctx.beginPath();
        this.ctx.moveTo(this.x0, this.y0);
        this.ctx.lineTo(this.space, this.space);
        this.ctx.lineTo(this.space + this.arrowSize / 2, this.space + this.arrowSize);
        this.ctx.lineTo(this.space - this.arrowSize / 2, this.space + this.arrowSize);
        this.ctx.lineTo(this.space, this.space);
        this.ctx.stroke();
        this.ctx.fill();
    };
    //绘制多个点,连成折线图
    LineChart.prototype.drawDotted = function (data) {
//        将数据的坐标需要转换成canvas坐标
        var that = this;
        var preCanvasX = 0;
        var preCanvasY = 0;
        //遍历数组进行绘点
        data.forEach(function (item, i) {
            var canvasX = that.x0 + item.x;
            var canvasY = that.y0 - item.y;
            //绘制点
            that.ctx.beginPath();
            that.ctx.moveTo(canvasX - that.dottedSize / 2, canvasY - that.dottedSize / 2);
            that.ctx.lineTo(canvasX + that.dottedSize / 2, canvasY - that.dottedSize / 2);
            that.ctx.lineTo(canvasX + that.dottedSize / 2, canvasY + that.dottedSize / 2);
            that.ctx.lineTo(canvasX - that.dottedSize / 2, canvasY + that.dottedSize / 2);
            that.ctx.closePath();
            that.ctx.fill();

            //连线
            if (i == 0) {
                that.ctx.beginPath();
                that.ctx.moveTo(that.x0, that.y0);
                that.ctx.lineTo(canvasX, canvasY);
                that.ctx.stroke();
            } else {
                that.ctx.beginPath();
                that.ctx.moveTo(preCanvasX, preCanvasY);
                that.ctx.lineTo(canvasX, canvasY);
                that.ctx.stroke();
            }
            //将这次的canvasX 和canvasY保存起来,为下次使用
            preCanvasX = canvasX;
            preCanvasY = canvasY;
        });

    };

    //定义一个包含多个点的数据
    var data = [
        {
            x: 100,
            y: 100
        },
        {
            x: 160,
            y: 140
        },
        {
            x: 250,
            y: 40
        },
        {
            x: 400,
            y: 300
        },
        {
            x: 500,
            y: 80
        }

    ];
    //初始化对象
    var lineChart = new LineChart();
    lineChart.init(data);
</script>
</body>
</html>
(2)生成随机颜色的扇形统计图:
1 效果图: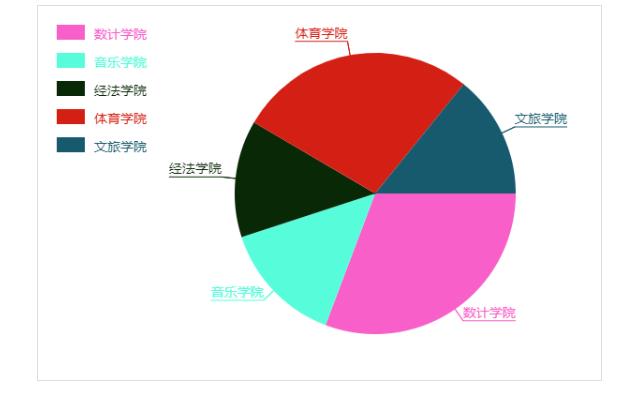
2.具体代码:
<!DOCTYPE html>
<html lang="en">
<head>
    <meta charset="UTF-8">
    <title>绘制扇形统计图</title>
    <style>
        canvas {
            border: solid 1px #dddddd;
            display: block;
            margin: auto;
        }
    </style>
</head>
<body>
<canvas width="600" height="400"></canvas>
<script>
    /*绘制扇形统计图(面向对象的思维)
     * 1.绘制扇形
     * 2.绘制标题
     *3. 绘制说明*/
    var PieChart = function (ctx) {
        //绘制工具
        this.ctx = ctx || document.querySelector('canvas').getContext('2d');
        //绘制饼图的中心;
        this.w = this.ctx.canvas.width;
        this.h = this.ctx.canvas.height;
        this.x0 = this.w / 2 + 60;
        this.y0 = this.h / 2;
        //饼图半径
        this.radius = 150;
        //标题伸出距离圆心的距离
        this.outline = 15;
        //说明矩形的宽和高
        this.rectW = 30;
        this.rectH = 16;
        this.space = 20;

    };
    PieChart.prototype.init = function (data) {
        this.drawPie(data);
    };
    PieChart.prototype.drawPie = function (data) {
        var that = this;
        //将角度转化为弧度
        var newData = this.transFormData(data);
        //绘制饼状图
        var startAngle = 0;
        newData.forEach(function (item, i) {
            var endAngle = startAngle + item.angle;
            that.ctx.beginPath();
            that.ctx.moveTo(that.x0, that.y0);
            that.ctx.arc(that.x0, that.y0, that.radius, startAngle, endAngle);
            //添加随机颜色
            var color = that.ctx.fillStyle = that.getRandomColor();
            that.ctx.fill();

            //调用画标题的方法.
            that.drawTitle(startAngle, item.angle, color, item.title);
            //调用画说明的方法
            that.drawDesc(i, item.title);


            //将下一次的起始值设为本次绘画的结束值
            startAngle = endAngle;


        });


    };
    PieChart.prototype.drawTitle = function (startAngle, angle, color, text) {
        /*需要先找到伸出点的坐标
         * 1.计算出斜边相对于圆点的坐标*/
        var edge = this.radius + this.outline;
        var edgeX = edge * Math.cos(startAngle + angle / 2);
        var edgeY = edge * Math.sin(startAngle + angle / 2);

        //伸出点的坐标
        var outX = this.x0 + edgeX;
        var outY = this.y0 + edgeY;

        //画线
        this.ctx.beginPath();
        this.ctx.moveTo(this.x0, this.y0);
        this.ctx.lineTo(outX, outY);
        this.ctx.strokeStyle = color;
        this.ctx.stroke();
        //画底部线;
        //字体大小
        this.ctx.font = "14px Microsoft YaHei";
        this.ctx.textBaseline = "bottom";
        var textWidth = this.ctx.measureText(text).width;
        if (outX > this.x0) {
            this.ctx.textAlign = 'left';
            this.ctx.lineTo(outX + textWidth, outY);
        } else {
            this.ctx.textAlign = 'right';
            this.ctx.lineTo(outX - textWidth, outY);
        }

        this.ctx.stroke();
        //画文字
        this.ctx.fillText(text, outX, outY);


    };
    PieChart.prototype.drawDesc = function (index, title) {
        /*画说明矩形*/
        this.ctx.fillRect(this.space, this.space + index * (this.space + 10), this.rectW, this.rectH);
        /*画说明内容*/
        this.ctx.beginPath();
        this.ctx.textAlign="left";
        this.ctx.textBaseline='top';
        this.ctx.fillText(title, this.space+this.rectW + 10, this.space + index * (this.space + 10));
    };
    //得到一个随机的颜色
    PieChart.prototype.getRandomColor = function () {
        var r = Math.floor(Math.random() * 256);
        var g = Math.floor(Math.random() * 256);
        var b = Math.floor(Math.random() * 256);
        return 'rgb(' + r + ',' + g + ',' + b + ')';
    };
    //将数据的需要统计的数据转换成弧度,并返回该数据
    PieChart.prototype.transFormData = function (data) {
        var total = 0;
        data.forEach(function (item, i) {
            total += item.num;
        });
        //计算出角度并添加一个属性记录角度
        data.forEach(function (item, i) {
            var angle = item.num / total * Math.PI * 2;
            item.angle = angle;
        });
        return data;
    };
    var data = [
        {title: '数计学院', num: 432},
        {title: '音乐学院', num: 200},
        {title: '经法学院', num: 189},
        {title: '体育学院', num: 385},
        {title: '文旅学院', num: 199}
    ];
    //实例化对象,并调用该对象的初始化方法
    var pieChart = new PieChart();
    pieChart.init(data);
</script>
</body>
</html>

