
python机器学习-chapter2_14
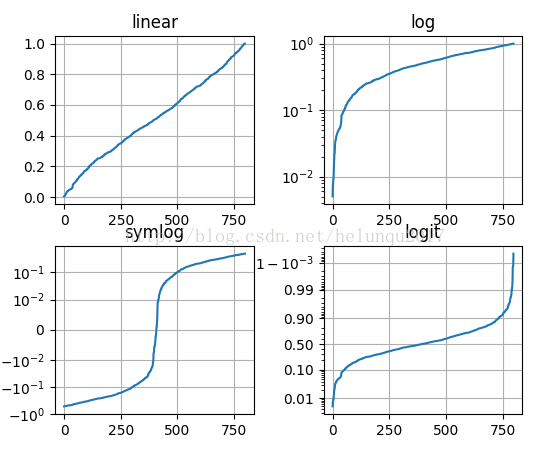
•xscale/yscale对数和其它非线性轴
import numpy as np
import matplotlib.pyplot as plt

#生成一些区间 [0,1]内的数据
y = np.random.normal(loc=0.5, scale=0.4, size=1000)
y = y[(y > 0) & (y < 1)]
y.sort()
x = np.arange(len(y))

#画图

plt.yscale('linear')                               #线性
plt.yscale('log')                                   #对数
plt.yscale('symlog', linthreshy=0.05)  #对称的对数
plt.yscale('logit')                                 #logit
plt.show()

 浙公网安备 33010602011771号