
<!DOCTYPE html>
<html>
<head>
<meta charset="utf-8">
<title>ECharts</title>
<!-- 引入 echarts.js -->
<script src="./echarts.min.js"></script>
</head>
<body style="background-color:#151414">
<div id="main" style="width: 100%;height: 500px;"></div>
<script type="text/javascript">
// 基于准备好的dom,初始化echarts实例
var charts = echarts.init(document.getElementById('main'));
var option = {
tooltip: {
trigger: 'item'
},
legend: {
orient: 'horizontal',
top: '3%',
left: 'center',
textStyle:{
color:"white"
},
},
xAxis: {
axisLine: {//x轴线的颜色以及宽度
show: true,
lineStyle: {
color: "white",
width: 0,
type: "solid"
}
},
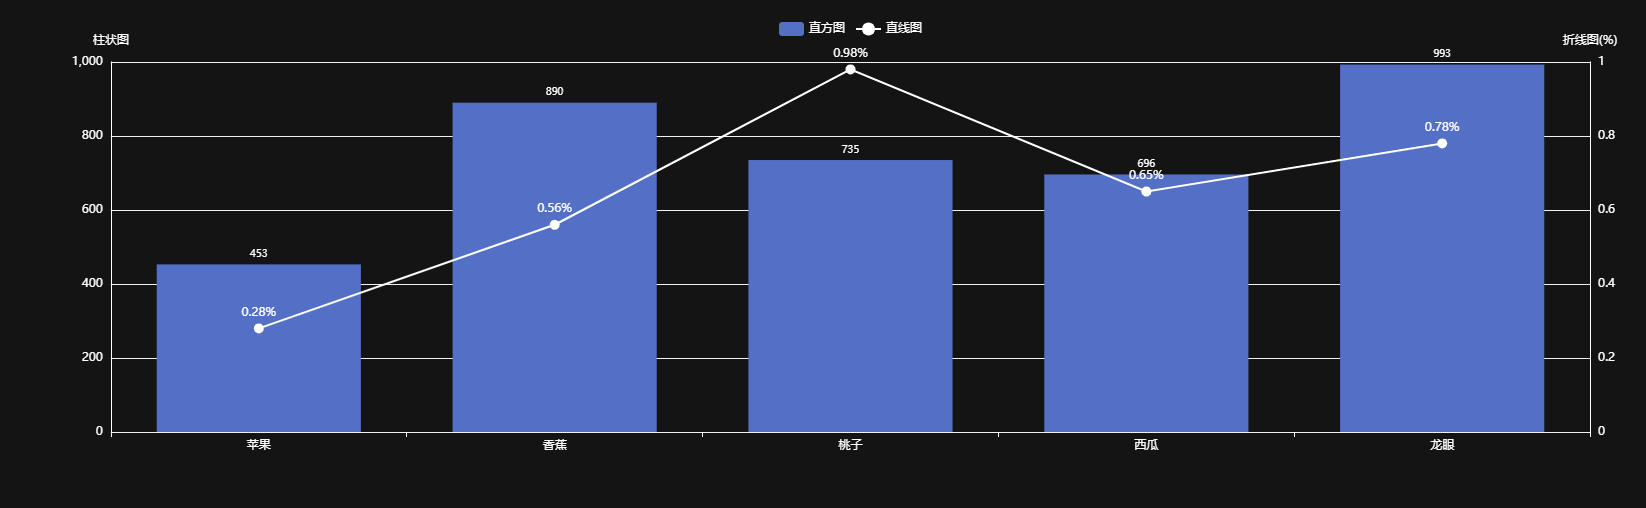
data: ['苹果','香蕉','桃子','西瓜','龙眼']
},
yAxis: [
{
type: 'value',
name: '柱状图',
axisLine: {//y轴线的颜色以及宽度
show: true,
lineStyle: {
color: "white",
width: 1,
type: "solid"
}
},
},
{
type: 'value',
name: '折线图(%)',
axisLabel: {
color: 'white'
},
axisLine: {
show: true,
lineStyle: {
color: 'white'
}
},
splitLine: {
lineStyle: {
color: 'white',
width: 1,
type: 'dotted'
}
},
nameTextStyle: {
rich: {
legend: {
width: 12,
height: 4,
backgroundColor: '#87CEFA'
},
value: {
color: '#CD853F'
}
}
}
}
],
series: [{
name: '直方图',
type: 'bar',
//barWidth:30,
//color: "#333",
barGap: '30%',//设置不重叠 当值为-100%时重叠
itemStyle: {
normal: {
label: {
show: true, //开启显示
position: 'top', //在上方显示
textStyle: { //数值样式
color: 'white',
fontSize: 10
}
}
}
},
data: [453,890,735,696,993]
},
{
name: '直线图',
type: 'line',
yAxisIndex: 1, //使用index=1的y坐标轴
connectNulls:true, //是否连接空数据
symbolSize:8, //设置折线上圆点大小
data: [0.28,0.56,0.98,0.65,0.78],
label: {
show: true,
position: 'top',
formatter: '{c}%',
color: 'white',
},
itemStyle: {
color: 'white', // 数据颜色
gradientColorNum: 1
},
lineStyle:{
width:2, // 设置虚线宽度
type:'solid' // 虚线'dotted' 实线'solid'
}
}
]
};
charts.setOption(option);
</script>
</body>
</html>
 posted on

 浙公网安备 33010602011771号