通过加速度计信号数据计算心率和呼吸率
通过加速度计信号数据计算心率和呼吸率
数据介绍
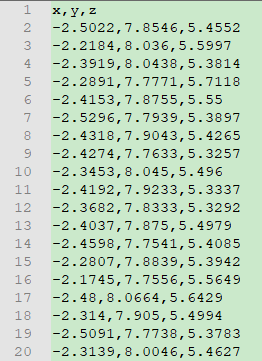
采用50Hz采样率的腕部加速度计数据,使用公开数据集UCI Mhealth Dataset。
具体形态如下:
算法逻辑
原始信号数据中包含一定噪声,先对数据进行一系列预处理,包含归一化、滚动平均平滑滤波、去除极值、三轴融合、带通滤波、傅里叶变换,计算出值。
计算心率
- 导入数据
import numpy as np
import matplotlib.pyplot as plt
from matplotlib import style
import scipy.fftpack
import scipy as sp
from scipy.stats import zscore
import pandas as pd
from scipy.signal import butter, filtfilt
from scipy import signal
import warnings
warnings.filterwarnings(action="ignore", module="scipy", message="^internal gelsd")
style.use('ggplot')
sampling_frequency = 50
data = pd.read_csv(input_file_path).values # 由dataframe变为array
- 原始数据可视化
save_plots = True
def plot(data, title, plot_save_path):
    N = len(data)
    y = np.linspace(0, N/sampling_frequency, N)
    plt.plot(y, data)
    plt.title(title)
    plt.ylabel('Acceleration Ax (m/s^2)')
    plt.xlabel('Time(s)')
    draw_plot(plot_save_path)
    plt.close()


def draw_plot(plot_save_path):
    if save_plots:
        plt.savefig(plot_save_path)
    else:
        plt.draw()
        plt.pause(5)

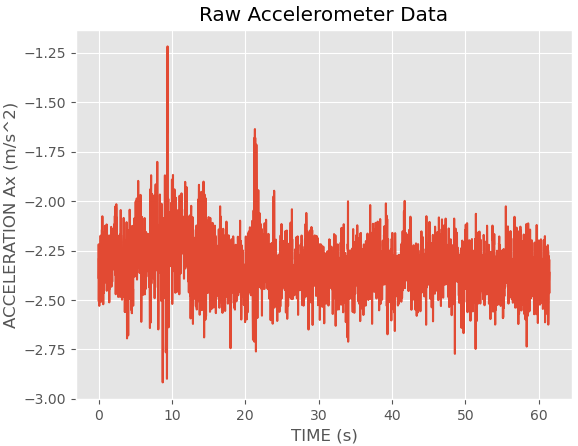
plot(data[:,0], 'Raw Accelerometer Data', 'plots/bio_watch/raw_ax.png')
- 归一化
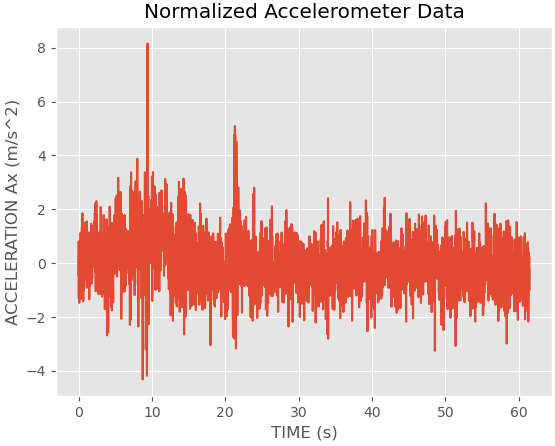
这里使用的是zscores。
def normalize(data):
    for i in range(0, 3):
        data[:,i] = sp.stats.zscore(data[:,i])
    return data

normalized_data = normalize(data)
plot(normalized_data[:,0], 'Normalized Accelerometer Data', 'plots/bio_watch/normalized.png')
- 滚动平均滤波
average_filter_window_duration_hr = int((1/7)*sampling_frequency)

def apply_average_filter(data, window):
    for i in range(0, 3):
        data[:,i] = np.array(pd.Series(data[:,i]).rolling(window=window).mean()) # 滚动平均计算
    return data

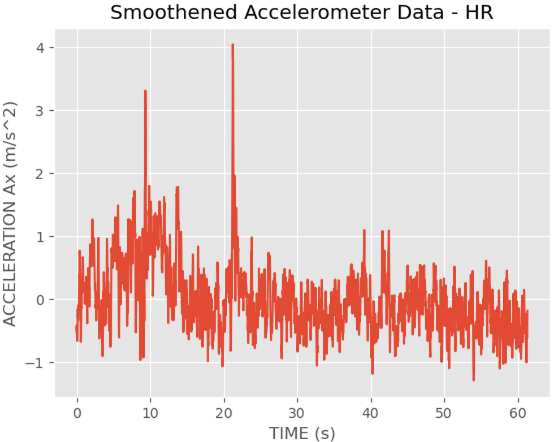
smooth_data = apply_average_filter(normalized_data, average_filter_window_duration_hr)
smooth_data = np.array(list(filter(lambda row: np.isfinite(np.sum(row)), smooth_data)), dtype=np.float64) # 因为滚动平均计算会出现极值,需要去掉极值
plot(smooth_data[:,0], 'Smoothened Accelerometer Data - HR', 'plots/bio_watch/smoothened_ax_hr.png')
- 带通滤波
low_cutoff_freq = 4
high_cutoff_freq = 11
smooth_data[:,0] = apply_bandpass_butterworth_filter(smooth_data[:,0], low_cutoff_freq, high_cutoff_freq)
smooth_data[:,1] = apply_bandpass_butterworth_filter(smooth_data[:,1], low_cutoff_freq, high_cutoff_freq)
smooth_data[:,2] = apply_bandpass_butterworth_filter(smooth_data[:,2], low_cutoff_freq, high_cutoff_freq)
plot(smooth_data[:,0], 'Bandpass-1 Accelerometer Data', 'plots/bio_watch/bandpass1_ax.png')

def aggregate_components(data):
    return np.array(list(map(lambda c: np.sqrt(np.sum(np.square(c))), data)), dtype=np.float64)
# np.square 是对每个元素平方,np.sum是对所有元素求和,np.sqrt是对每个元素开方
# 整体是对data每行数据进行操作,然后得到一个3066的新数组

aggregated_data = aggregate_components(smooth_data)

high_cutoff_freq = 2.5
low_cutoff_freq = 0.66
bandpass2_data = apply_bandpass_butterworth_filter(aggregated_data, low_cutoff_freq, high_cutoff_freq)
- 傅里叶变换
def fft(acc_data, f_low, f_high, plot_save_path):
    acc_data = acc_data[~np.isnan(acc_data)]
    acc_data = sp.signal.detrend(acc_data)
    N = len(acc_data)
    fft_data = sp.fftpack.fft(acc_data)
    f = np.linspace(0, N/sampling_frequency, N)

    plt.plot(f, np.abs(fft_data))
    plt.xlabel('Frequency in Hertz [Hz]')
    plt.ylabel('Magnitude')
    plt.title('FFT')
    draw_plot(plot_save_path)
    plt.close()

    max_amp = 0
    max_index = 0
    index = 0
    for c in fft_data:
        if f[index] < f_low or f[index] > f_high:
            index = index + 1
            continue
        real = np.real(c)
        img = np.imag(c)
        amp = np.sqrt(real*real + img*img)
        if max_amp < amp:
            max_amp = amp
            max_index = index
        index = index + 1

    return max_amp, f[max_index]
- 计算出值
max_amp, max_freq = fft(bandpass2_data, 0.66, 2.5, 'plots/bio_watch/hr_fft.png')
print('Max Amplitude:', max_amp)
print('Max Frequency:', max_freq)
print('Heart Rate (bpm):', 60*max_freq)
结果显示:
Max Amplitude: 16.751657650670722
Max Frequency: 1.0403393148450244
Heart Rate (bpm): 62.420358890701465
计算呼吸率
- 滚动平均滤波
average_filter_window_duration_br = int((40/60)*sampling_frequency)
smooth_data = apply_average_filter(normalized_data, average_filter_window_duration_br)
amp_to_freq = {}
breathing_low_freq = 0.13
breathing_high_freq = 0.66
print('Max Amplitude within 0.13 and 0.66 Hz frequency:')
br_x_amp, br_x_f = fft(smooth_data[:,0], breathing_low_freq, breathing_high_freq, 'plots/bio_watch/br_fft_xaxis.png')
amp_to_freq[br_x_amp] = br_x_f
print('X-Axis:', br_x_amp)
br_y_amp, br_y_f = fft(smooth_data[:,1], breathing_low_freq, breathing_high_freq, 'plots/bio_watch/br_fft_yaxis.png')
amp_to_freq[br_y_amp] = br_y_f
print('Y-Axis:', br_y_amp)
br_z_amp, br_z_f = fft(smooth_data[:,2], breathing_low_freq, breathing_high_freq, 'plots/bio_watch/br_fft_zaxis.png')
amp_to_freq[br_z_amp] = br_z_f
print('Z-Axis:', br_z_amp)
br_max_amp = max([br_x_amp, br_y_amp, br_z_amp]) # 计算最大幅值
结果显示:
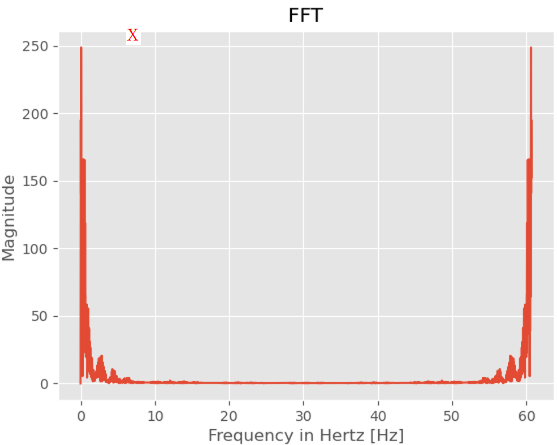
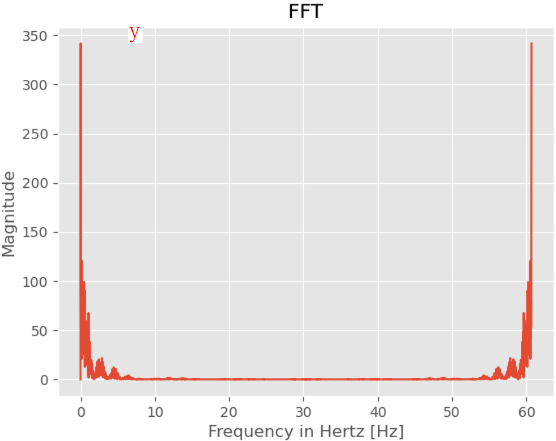
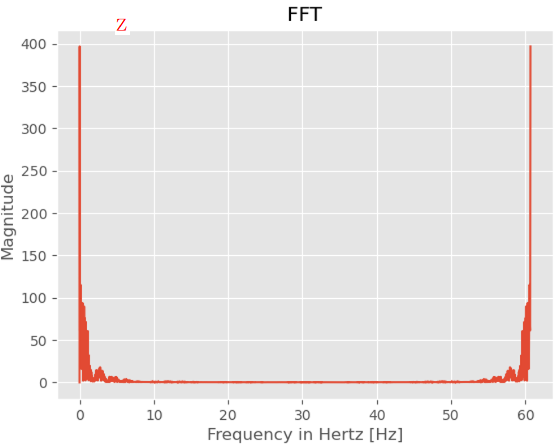
Max Amplitude within 0.13 and 0.66 Hz frequency:
X-Axis: 166.01035262050627
Y-Axis: 120.77779723778674
Z-Axis: 115.25675615869964
- 计算出值
print("Max amplitude chosen:", br_max_amp)
print("Frequency of chosen amplitude:", amp_to_freq[br_max_amp])
print("Respiratory Rate (bpm):", 60*amp_to_freq[br_max_amp])
结果显示:
Max amplitude chosen: 166.01035262050627
Frequency of chosen amplitude: 0.3601186943620178
Respiratory Rate (bpm): 21.60712166172107


