python画图
python画折线图
为了刻画自变量和因变量的关系,通常将二者可视化出来。折线图是比较好的方法。主要的关键点是将x轴和y轴坐标搞出来
代码:
import matplotlib.pyplot as plt
x = []
    y1 = []
    y2 = []
    y3 = []
    y4 = []
    hr_den_max = res['HR_density'].max()
    hr_den_min = res['HR_density'].min()
    print(res['HR_density'].max())
    print(res['HR_density'].min())

    for i in range(int(hr_den_min) + 1, int(hr_den_max), 5):
        x.append(i)
        res_i = res[res['HR_density'] <= i]
        mae_i = res_i["fuse_MAE"].mean()
        y1.append(mae_i)
        mae_FM = res_i["FM_err"].mean()
        y2.append(mae_FM)
        mae_BW = res_i["BW_err"].mean()
        y3.append(mae_BW)
        mae_AM = res_i["AM_err"].mean()
        y4.append(mae_AM)

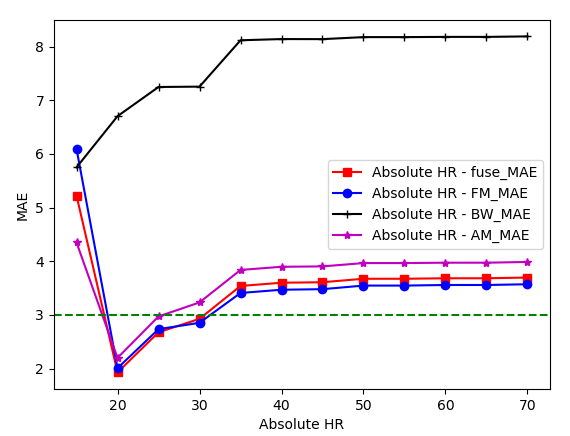
    plt.plot(x, y1, 's-', color='r', label="Absolute HR - fuse_MAE")  # s-:方形
    plt.plot(x, y2, 'o-', color='b', label="Absolute HR - FM_MAE")  # s-:圆形
    plt.plot(x, y3, '+-', color='k', label="Absolute HR - BW_MAE")
    plt.plot(x, y4, '*-', color='m', label="Absolute HR - AM_MAE")

    plt.axhline(y=3.0, color='g', linestyle='--')
    plt.xlabel("Absolute HR")  # 横坐标名字
    plt.ylabel("MAE")  # 纵坐标名字
    plt.legend(loc="best")  # 图例
    #plt.show()
    plt.savefig(save_path + 'HR_density_MAE' + '.png', dpi=750, bbox_inches='tight')
    plt.close('all')
结果如下:

python画多幅图
代码:
fig = plt.figure(dpi=450, figsize=(30, 16), layout="constrained")
spec = fig.add_gridspec(2, 6) # 画2张横图,竖图是6张
ax_1 = fig.add_subplot(spec[0, :])  # 第一张,占满画板
plt.plot(data_array, color='r')
ax_1.set_title(title_str)
for i in range(6):  # 第二张,为6张竖图
    ax_ppg_seg = fig.add_subplot(spec[1, i])
    plt.plot(data[i], color='r')
    ax_ppg_seg.set_title(title_str) #每张小图都有title
按照以上模板则可以画出想要的多幅图


