python对时间戳数据进行可视化
python对时间戳数据进行可视化
步骤1:加载模块&读取数据
import pandas as pd
import os
import matplotlib.pyplot as plt
import time
import datetime

plt.rcParams['font.sans-serif'] = ['SimHei']  # 设置字体为simhei显示中文
plt.rcParams['axes.unicode_minus'] = False
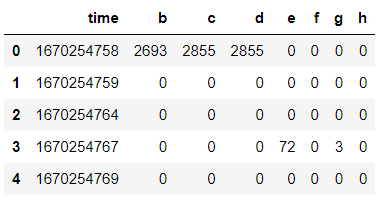
df = pd.read_csv(name, sep="\t", header=None) # 读取数据
df.columns = ['time',  'b', 'c', 'd', 'e', 'f', 'g', 'h'] #列名
t = pd.to_datetime(df['time_s'])
y = df['b']


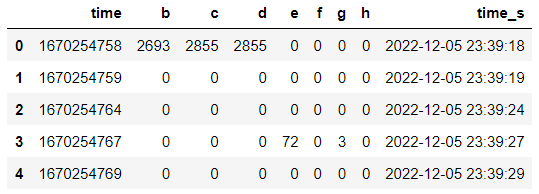
步骤2:将时间戳转为时间
df['time_s'] = df['time'].apply(lambda x: datetime.datetime.fromtimestamp(x).strftime("%Y-%m-%d %H:%M:%S"))

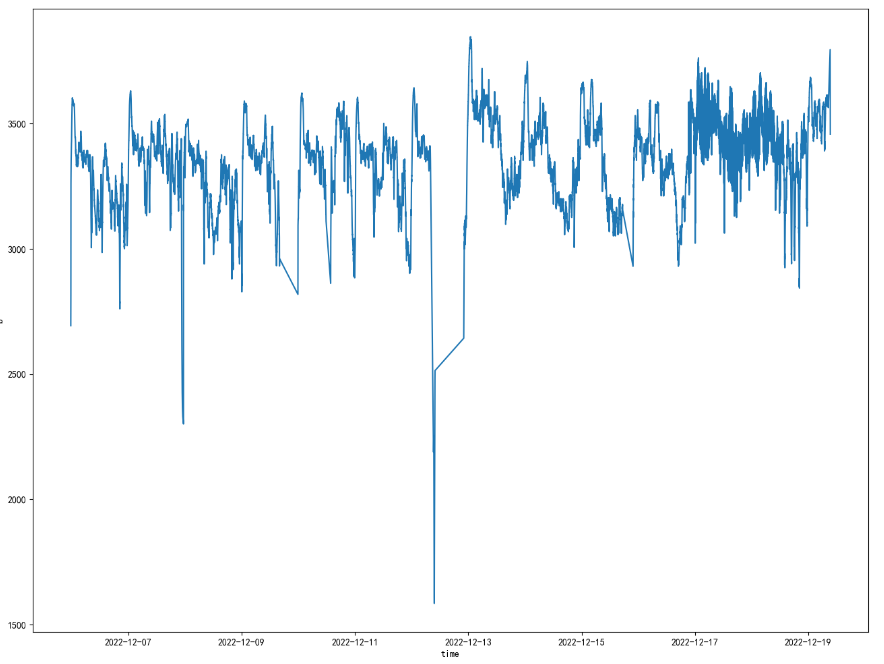
步骤3:作图
plt.figure(fname, figsize=(16, 12))
y = df['b']
sel = y > 0
sel_t, sel_y = t[sel].to_numpy(), y[sel].to_numpy()

plt.plot(sel_t, sel_y, '-')
plt.xlabel('time')
plt.ylabel('b')

步骤4:作图
plt.figure(fname, figsize=(16, 12))
y = df['b'].to_numpy()
plt.plot(t.to_numpy(), y, '-')
plt.xlabel('time')
plt.ylabel('b')


