
python 特征选择 绘图 + mine
demo代码:
# _*_coding:UTF-8_*_
import numpy as np
import sys
import pandas as pd
from pandas import Series,DataFrame
import numpy as np
import sys
from sklearn import preprocessing
from sklearn.ensemble import ExtraTreesClassifier
import os
from minepy import MINE

def iterbrowse(path):
    for home, dirs, files in os.walk(path):
        for filename in files:
            yield os.path.join(home, filename)


def get_data(filename):
    white_verify = []
    with open(filename) as f:
        lines = f.readlines()
        data = {}
        for line in lines:
            a = line.split("\t")
            if len(a) != 78:
                print(line)
                raise Exception("fuck")
            white_verify.append([float(n) for n in a[3:]])
    return white_verify


if __name__ == '__main__':
    # pdb.set_trace()
    neg_file = "cc_data/black_all.txt"
    pos_file = "cc_data/white_all.txt"
    X = []
    y = []
    if os.path.isfile(pos_file):
        if pos_file.endswith('.txt'):
            pos_set = np.genfromtxt(pos_file)
        elif pos_file.endswith('.npy'):
            pos_set = np.load(pos_file)
        X.extend(pos_set)
        y += [0] * len(pos_set)
    if os.path.isfile(neg_file):
        if neg_file.endswith('.txt'):
            neg_set = np.genfromtxt(neg_file)
        elif neg_file.endswith('.npy'):
            neg_set = np.load(neg_file)

        '''
        X.extend(list(neg_set) * 5)
        y += [1] * (5 * len(neg_set))
        '''
        X.extend(neg_set)
        y += [1] * len(neg_set)

    print("len of X:", len(X))
    print("X sample:", X[:3])
    print("len of y:", len(y))
    print("y sample:", y[:3])
    X = [x[3:] for x in X]
    print("filtered X sample:", X[:3])

    cols = [str(i + 6) for i in range(len(X[0]))]
    clf = ExtraTreesClassifier()
    clf.fit(X, y)
    print (clf.feature_importances_)
    print "Features sorted by their score:"
    print sorted(zip(clf.feature_importances_, cols), reverse=True)

    black_verify = []
    for f in iterbrowse("todo/top"):
        print(f)
        black_verify += get_data(f)
    # ValueError: operands could not be broadcast together with shapes (1,74) (75,) (1,74)
    print(black_verify)
    black_verify_labels = [3] * len(black_verify)

    white_verify = get_data("todo/white_verify.txt")
    print(white_verify)
    white_verify_labels = [2] * len(white_verify)

    unknown_verify = get_data("todo/pek_feature74.txt")
    print(unknown_verify)

    # extend data
    X = np.concatenate((X, black_verify))
    y += black_verify_labels
    X = np.concatenate((X, white_verify))
    y += white_verify_labels

    #################################### plot ####################################
    data_train = pd.DataFrame(X)
    # cols = [str(i) for i in range(6, 81)]
    data_train.columns = cols

    # add label column
    # data_train = data_train.assign(label=pd.Series(y))
    data_train["label"] = pd.Series(y)

    print(data_train.info())
    print(data_train.columns)


    import matplotlib.pyplot as plt

    for col in cols:
        fig = plt.figure(figsize=(20, 16), dpi=8)
        fig.set(alpha=0.2)
        plt.figure()
        data_train[data_train.label == 0.0][col].plot()
        data_train[data_train.label == 1.0][col].plot()
        data_train[data_train.label == 2.0][col].plot()
        data_train[data_train.label == 3.0][col].plot()
        plt.xlabel(u"sample data id")
        plt.ylabel(u"value")
        plt.title(col)
        plt.legend((u'white', u'black', u"white-todo", u"black-todo"), loc='best')
        plt.show()

    print "calculate MINE mic value:"
    for col in cols:
        print col,
        mine = MINE(alpha=0.6, c=15,
                    est="mic_approx")  # http://minepy.readthedocs.io/en/latest/python.html#second-example
        mine.compute_score(data_train[col], y)
        print "MIC=", mine.mic()

    sys.exit(-1)
extend data 表示待预测的数据
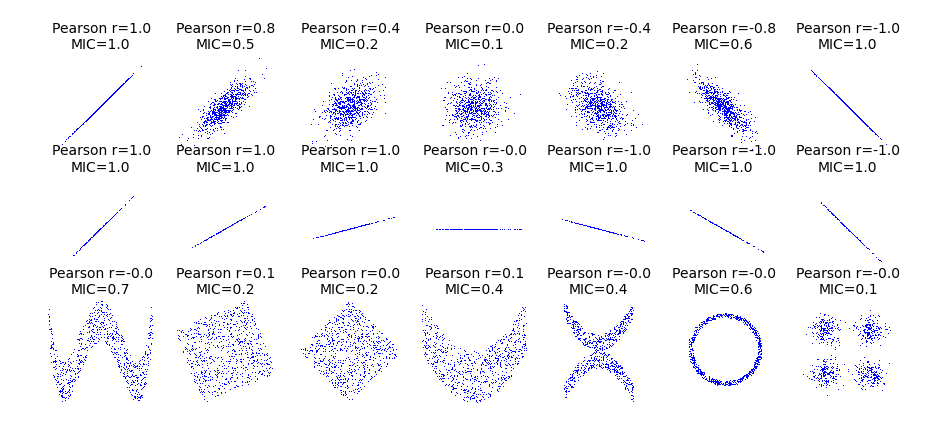
关于mic:
from __future__ import division
import numpy as np
import matplotlib.pyplot as plt
from minepy import MINE


rs = np.random.RandomState(seed=0)

def mysubplot(x, y, numRows, numCols, plotNum,
              xlim=(-4, 4), ylim=(-4, 4)):

    r = np.around(np.corrcoef(x, y)[0, 1], 1)
    mine = MINE(alpha=0.6, c=15, est="mic_approx")
    mine.compute_score(x, y)
    mic = np.around(mine.mic(), 1)
    ax = plt.subplot(numRows, numCols, plotNum,
                     xlim=xlim, ylim=ylim)
    ax.set_title('Pearson r=%.1f\nMIC=%.1f' % (r, mic),fontsize=10)
    ax.set_frame_on(False)
    ax.axes.get_xaxis().set_visible(False)
    ax.axes.get_yaxis().set_visible(False)
    ax.plot(x, y, ',')
    ax.set_xticks([])
    ax.set_yticks([])
    return ax

def rotation(xy, t):
    return np.dot(xy, [[np.cos(t), -np.sin(t)], [np.sin(t), np.cos(t)]])

def mvnormal(n=1000):
    cors = [1.0, 0.8, 0.4, 0.0, -0.4, -0.8, -1.0]
    for i, cor in enumerate(cors):
        cov = [[1, cor],[cor, 1]]
        xy = rs.multivariate_normal([0, 0], cov, n)
        mysubplot(xy[:, 0], xy[:, 1], 3, 7, i+1)

def rotnormal(n=1000):
    ts = [0, np.pi/12, np.pi/6, np.pi/4, np.pi/2-np.pi/6,
          np.pi/2-np.pi/12, np.pi/2]
    cov = [[1, 1],[1, 1]]
    xy = rs.multivariate_normal([0, 0], cov, n)
    for i, t in enumerate(ts):
        xy_r = rotation(xy, t)
        mysubplot(xy_r[:, 0], xy_r[:, 1], 3, 7, i+8)

def others(n=1000):
    x = rs.uniform(-1, 1, n)
    y = 4*(x**2-0.5)**2 + rs.uniform(-1, 1, n)/3
    mysubplot(x, y, 3, 7, 15, (-1, 1), (-1/3, 1+1/3))

    y = rs.uniform(-1, 1, n)
    xy = np.concatenate((x.reshape(-1, 1), y.reshape(-1, 1)), axis=1)
    xy = rotation(xy, -np.pi/8)
    lim = np.sqrt(2+np.sqrt(2)) / np.sqrt(2)
    mysubplot(xy[:, 0], xy[:, 1], 3, 7, 16, (-lim, lim), (-lim, lim))

    xy = rotation(xy, -np.pi/8)
    lim = np.sqrt(2)
    mysubplot(xy[:, 0], xy[:, 1], 3, 7, 17, (-lim, lim), (-lim, lim))

    y = 2*x**2 + rs.uniform(-1, 1, n)
    mysubplot(x, y, 3, 7, 18, (-1, 1), (-1, 3))

    y = (x**2 + rs.uniform(0, 0.5, n)) * \
        np.array([-1, 1])[rs.random_integers(0, 1, size=n)]
    mysubplot(x, y, 3, 7, 19, (-1.5, 1.5), (-1.5, 1.5))

    y = np.cos(x * np.pi) + rs.uniform(0, 1/8, n)
    x = np.sin(x * np.pi) + rs.uniform(0, 1/8, n)
    mysubplot(x, y, 3, 7, 20, (-1.5, 1.5), (-1.5, 1.5))

    xy1 = np.random.multivariate_normal([3, 3], [[1, 0], [0, 1]], int(n/4))
    xy2 = np.random.multivariate_normal([-3, 3], [[1, 0], [0, 1]], int(n/4))
    xy3 = np.random.multivariate_normal([-3, -3], [[1, 0], [0, 1]], int(n/4))
    xy4 = np.random.multivariate_normal([3, -3], [[1, 0], [0, 1]], int(n/4))
    xy = np.concatenate((xy1, xy2, xy3, xy4), axis=0)
    mysubplot(xy[:, 0], xy[:, 1], 3, 7, 21, (-7, 7), (-7, 7))

plt.figure(facecolor='white')
mvnormal(n=800)
rotnormal(n=200)
others(n=800)
plt.tight_layout()
plt.show()

 浙公网安备 33010602011771号