
ES JVM使用如果超过75%就会GC较多,导致ES索引性能下降
转自:https://www.elastic.co/guide/en/cloud/current/ec-metrics-memory-pressure.html
Scenario: How Does High Memory Pressure Affect Performance?
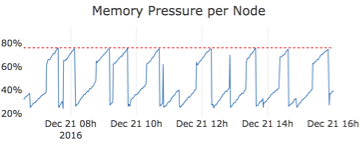
When you load up a cluster with an indexing and search workload that matches the size of the cluster well, you typically get the classic JVM heap sawtooth pattern as memory gets used and then gets freed up again by the garbage collector. Memory usage increases until it reaches 75% and then drops again as memory is freed up:
Now let’s suppose you have a cluster with three nodes and much higher memory pressure overall. In this example, two of the three nodes are maxing out very regularly for extended periods and one node is consistently hovering around the 75% mark where garbage collection kicks in.
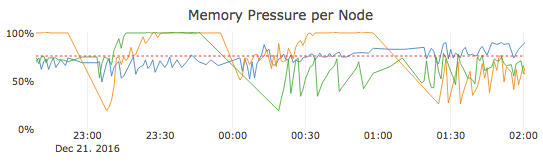
High memory pressure works against cluster performance in two ways: As memory pressure rises to 75% and above, less memory remains available, but your cluster now also needs to spend some CPU resources to reclaim memory through garbage collection. These CPU resources are not available to handle user requests while garbage collection is going on. As a result, response times for user requests increases as the system becomes more and more resource constrained. If memory pressure continues to rise and reaches near 100%, a much more aggressive form of garbage collection is used, which will in turn affect cluster response times dramatically.
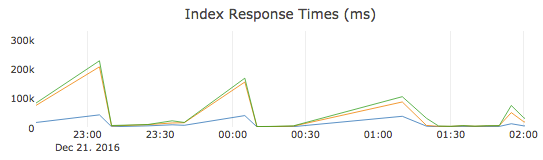
In our example, the Index Response Times metric shows that high memory pressure leads to a significant performance impact. As two of the three nodes max out their memory several times and plateau at 100% memory pressure for 30 to 45 minutes at a time, there is a sharp increase in the index response times around 23:00, 00:00, and 01:00. Search response times, which are not shown, also increase but not as dramatically. Only the node in blue that consistently shows a much healthier memory pressure that rarely exceeds 75% can sustain a lower response time.
If the performance impact from high memory pressure is not acceptable, you need to increase the cluster size or reduce the workload.

 浙公网安备 33010602011771号