splunk 索引过程
术语:
Event :Events are records of activity in log files, stored in Splunk indexes. 简单说,处理的日志或话单中中一行记录就是一个Event;
Source type: 来源类型,identifies the format of the data,简单说,一种特定格式的日志,可以定义为一种source type;Splunk默认提供有500多种确定格式数据的type,包括apache log、常见OS的日志、Cisco等网络设备的日志等;
Index: The index is the repository for Splunk Enterprise data. Splunk transforms incoming data into events, which it stores in indexes. 有两层含义:一是数据物理存储上的表达,也是一个数据处理的动作表达:Splunk indexes your data,这个过程会产生两类数据:
The raw data in compressed form (rawdata)
Indexes that point to the raw data, plus some metadata files (index files)
Indexer: An indexer is a Splunk Enterprise instance that indexes data. 通常说的索引概念,也是对Splunk中“Indexer”这个特定模块的称呼,是一种Splunk Enterprise Instance;
Bucket: Index储存的两类数据按照age组织为不同的目录,称为buckets;
职责——具体再见后文图:
Search Head:前端搜索;
Deployment Server:相当于配置管理中心,对其它节点统一管理;
Forwarder:负责收集、预处理和前转数据至Indexer(consume data and forward it on to indexers),配合构成类似Flume的Agent和Collector的机制;动作包括:
· Tagging of metadata (source, sourcetype, and host)
· Configurable buffering
· Data compression
· SSL security
· Use of any available network ports
· Running scripted inputs locally
注意:转发器可以传输三种类型的数据:原始、未解析、已解析。转发器可以发送的数据类型取决于转发器类型以及配置方式。通用转发器和轻型转发器可以发送原始或未解析
的数据。重型转发器可以发送原始或解析的数据。
Indexer:负责对数据“索引化”处理,即indexing process,也可称为event processing;包括:
· Separating the datastream into individual, searchable events.(分行)
· Creating or identifying timestamps. (识别时间戳)
· Extracting fields such as host, source, and sourcetype. (外置公共字段处理)
· Performing user-defined actions on the incoming data, such as identifying custom fields, masking sensitive data, writing new or modified keys, applying breaking rules for multi-line events, filtering unwanted events, and routing events to specified indexes or servers.
Parts of an indexer cluster——分布式部署
An indexer cluster is a group of Splunk Enterprise instances, or nodes, that, working in concert, provide a redundant indexing and searching capability. Each cluster has three types of nodes:
- A single master node to manage the cluster.
- Several to many peer nodes to index and maintain multiple copies of the data and to search the data.
- One or more search heads to coordinate searches across the set of peer nodes.
The master node manages the cluster. It coordinates the replicating activities of the peer nodes and tells the search head where to find data. It also helps manage the configuration of peer nodes and orchestrates remedial activities if a peer goes down.
The peer nodes receive and index incoming data, just like non-clustered, stand-alone indexers. Unlike stand-alone indexers, however, peer nodes also replicate data from other nodes in the cluster. A peer node can index its own incoming data while simultaneously storing copies of data from other nodes. You must have at least as many peer nodes as the replication factor. That is, to support a replication factor of 3, you need a minimum of three peer nodes.
The search head runs searches across the set of peer nodes. You must use a search head to manage searches across indexer clusters.——将搜索请求发给indexer节点,然后合并搜索请求
For most purposes, it is recommended that you use forwarders to get data into the cluster.
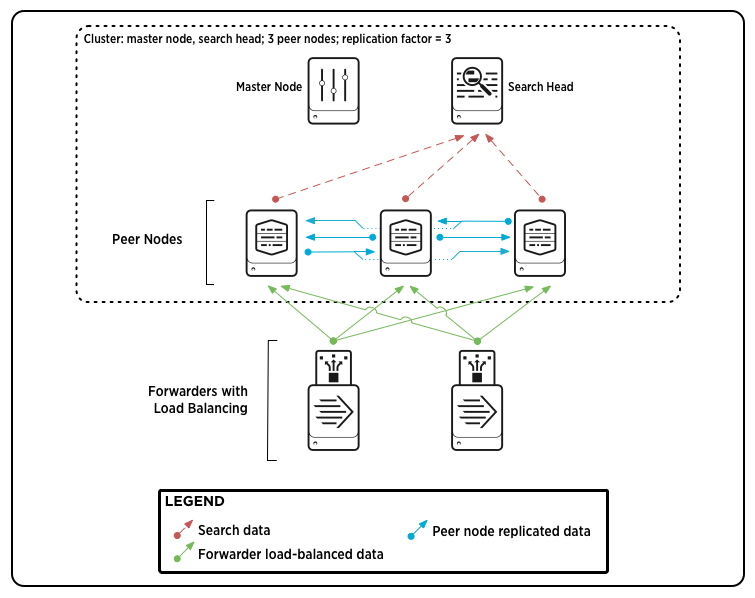
Here is a diagram of a basic, single-site indexer cluster, containing three peer nodes and supporting a replication factor of 3:
This diagram shows a simple deployment, similar to a small-scale non-clustered deployment, with some forwarders sending load-balanced data to a group of indexers (peer nodes), and the indexers sending search results to a search head. There are two additions that you don't find in a non-clustered deployment:
- The indexers are streaming copies of their data to other indexers.
- The master node, while it doesn't participate in any data streaming, coordinates a range of activities involving the search peers and the search head.
How indexing works
Splunk Enterprise can index any type of time-series data (data with timestamps). When Splunk Enterprise indexes data, it breaks it into events, based on the timestamps.
Event processing
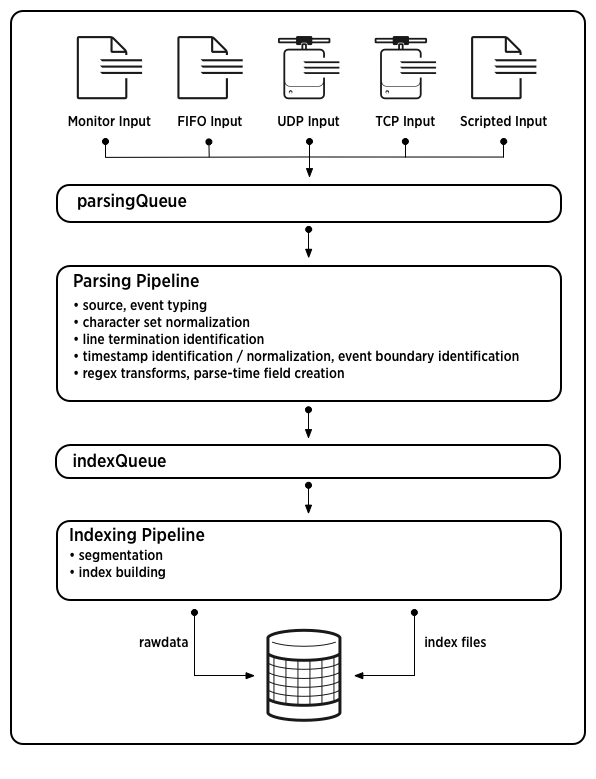
Event processing occurs in two stages, parsing and indexing. All data that comes into Splunk Enterprise enters through the parsing pipeline as large (10,000 bytes) chunks. During parsing, Splunk Enterprise breaks these chunks into events which it hands off to the indexing pipeline, where final processing occurs.
While parsing, Splunk Enterprise performs a number of actions, including:
- Extracting a set of default fields for each event, including
host,source, andsourcetype. - Configuring character set encoding.
- Identifying line termination using linebreaking rules. While many events are short and only take up a line or two, others can be long.
- Identifying timestamps or creating them if they don't exist. At the same time that it processes timestamps, Splunk identifies event boundaries.
- Splunk can be set up to mask sensitive event data (such as credit card or social security numbers) at this stage. It can also be configured toapply custom metadata to incoming events.
In the indexing pipeline, Splunk Enterprise performs additional processing, including:
- Breaking all events into segments that can then be searched upon. You can determine the level of segmentation, which affects indexing and searching speed, search capability, and efficiency of disk compression.
- Building the index data structures.
- Writing the raw data and index files to disk, where post-indexing compression occurs.
The breakdown between parsing and indexing pipelines is of relevance mainly when deploying forwarders. Heavy forwarders can parse data and then forward the parsed data on to indexers for final indexing. Some source types - those that reference structured data - require configuration on the forwarder prior to indexing. See "Extract data from files with headers".
For more information about events and what happens to them during the indexing process, see the chapter "Configure event processing" in the Getting Data In Manual.
Note: Indexing is an I/O-intensive process.
This diagram shows the main processes inherent in indexing:
Note: This diagram represents a simplified view of the indexing architecture. It provides a functional view of the architecture and does not fully describe Splunk Enterprise internals. In particular, the parsing pipeline actually consists of three pipelines: parsing, merging, and typing, which together handle the parsing function. The distinction can matter during troubleshooting, but does not generally affect how you configure or deploy Splunk Enterprise.
How indexer acknowledgment works
In brief, indexer acknowledgment works like this: The forwarder sends data continuously to the receiving peer, in blocks of approximately 64kB. The forwarder maintains a copy of each block in memory until it gets an acknowledgment from the peer. While waiting, it continues to send more data blocks.
If all goes well, the receiving peer:
1. receives the block of data, parses and indexes it, and writes the data (raw data and index data) to the file system.
2. streams copies of the raw data to each of its target peers.
3. sends an acknowledgment back to the forwarder.
The acknowledgment assures the forwarder that the data was successfully written to the cluster. Upon receiving the acknowledgment, the forwarder releases the block from memory.
If the forwarder does not receive the acknowledgment, that means there was a failure along the way. Either the receiving peer went down or that peer was unable to contact its set of target peers. The forwarder then automatically resends the block of data. If the forwarder is using load-balancing, it sends the block to another receiving node in the load-balanced group. If the forwarder is not set up for load-balancing, it attempts to resend data to the same node as before.
Important: To ensure end-to-end data fidelity, you must explicitly enable indexer acknowledgment for each forwarder that's sending data to the cluster, as described earlier in this topic. If end-to-end data fidelity is not a requirement for your deployment, you can skip this step.
For more information on how indexer acknowledgment works, read "Protect against loss of in-flight data" in the Forwarding Data manual.


 浙公网安备 33010602011771号