使用psscan检测dkom攻击——对于那些直接修改内存对象的rootkit,例如通过dkom实现进程隐藏,这个命令就非常好用了
pslist 和 psscan 的区别
列表:
“ pslist ” 模块使用与将在实时计算机上执行的任务列表命令相同的算法。 而且,Windows 任务管理器也使用相同的方法。
上面提到的命令“pslist”遍历 Windows 内核维护的活动进程结构列表。
windows内核使用EPROCESS数据结构来描述每一个正在运行的进程。 EPROCESS 结构的内容允许操作系统确定代码和进程地址空间在内存中的位置,并指定与进程关联的线程。 此结构还包含指向允许 Windows(和内存分析工具)从虚拟内存映射到物理内存的结构的指针。 此外,EPROCESS 数据结构包含指针,它们构成了活动进程的双向循环列表。 一个进程的 EPROCESS 结构的前向指针指向下一个进程的 EPROCESS 结构; 向后指针指定前一个进程的 EPROCESS 结构的地址。 并且,这个 EPROCESS 结构的双向链表由 PsActiveProcessHead指向
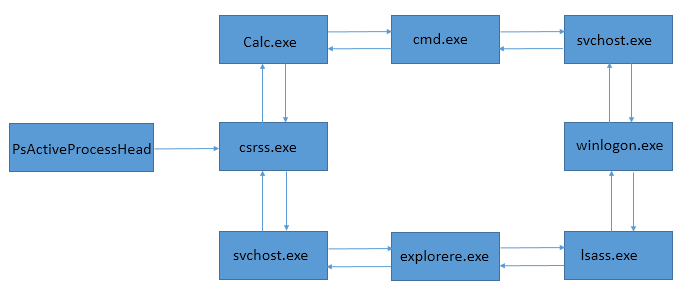 |
| 图。1 |
然而,恶意进程可以从这个列表中删除 EPROCESS 块,同时继续运行。 内核调度程序不使用此列表来实际更改上下文和执行进程。因此,rootkit 用来隐藏进程的一种方法是简单地取消进程与活动进程列表的链接。
$ python vol.py -f ~/Downloads/unknown.img pslist
 |
| 图 2 |
扫描:
psscan
模块不信任进程的链表,而是通过启发式查找代表进程的 EPROCESS 结构来搜索内存。因此,它列出了所有进程,这些进程甚至被 rootkit
隐藏并且没有被 pslist 命令显示或者windows的tasklist命令。 pslist 和 psscan
显示的进程列表之间的任何差异都表明安装了 rootkit。
在恶意软件分析诀窍与工具箱这本书里,提到了隐藏进程检测原理,关键内容我摘录如下:


如下是一个ppt实验的情况:


我自己使用vol3动手实验如下:
PS D:\Application\volatility3-stable> python .\vol.py -f D:\book\malwarecookbook-master\malwarecookbook-master\15\6\prolaco.vmem\prolaco.vmem windows.pslist
Volatility 3 Framework 2.4.1
Progress:  100.00               PDB scanning finished
PID     PPID    ImageFileName   Offset(V)       Threads Handles SessionId       Wow64   CreateTime      ExitTime        File output

4       0       System  0x810b1660      56      253     N/A     False   N/A     N/A     Disabled
544     4       smss.exe        0xff2ab020      3       21      N/A     False   2010-08-11 06:06:21.000000      N/A     Disabled
608     544     csrss.exe       0xff1ecda0      11      349     0       False   2010-08-11 06:06:23.000000      N/A     Disabled
632     544     winlogon.exe    0xff1ec978      19      565     0       False   2010-08-11 06:06:23.000000      N/A     Disabled
676     632     services.exe    0xff247020      16      269     0       False   2010-08-11 06:06:24.000000      N/A     Disabled
688     632     lsass.exe       0xff255020      19      341     0       False   2010-08-11 06:06:24.000000      N/A     Disabled
844     676     vmacthlp.exe    0xff218230      1       24      0       False   2010-08-11 06:06:24.000000      N/A     Disabled
856     676     svchost.exe     0x80ff88d8      16      198     0       False   2010-08-11 06:06:24.000000      N/A     Disabled
936     676     svchost.exe     0xff217560      9       256     0       False   2010-08-11 06:06:24.000000      N/A     Disabled
1028    676     svchost.exe     0x80fbf910      63      1334    0       False   2010-08-11 06:06:24.000000      N/A     Disabled
1088    676     svchost.exe     0xff22d558      4       75      0       False   2010-08-11 06:06:25.000000      N/A     Disabled
1148    676     svchost.exe     0xff203b80      14      207     0       False   2010-08-11 06:06:26.000000      N/A     Disabled
1432    676     spoolsv.exe     0xff1d7da0      13      135     0       False   2010-08-11 06:06:26.000000      N/A     Disabled
1668    676     vmtoolsd.exe    0xff1b8b28      5       219     0       False   2010-08-11 06:06:35.000000      N/A     Disabled
1788    676     VMUpgradeHelper 0xff1fdc88      3       97      0       False   2010-08-11 06:06:38.000000      N/A     Disabled
1968    676     TPAutoConnSvc.e 0xff143b28      5       100     0       False   2010-08-11 06:06:39.000000      N/A     Disabled
216     676     alg.exe 0xff25a7e0      6       104     0       False   2010-08-11 06:06:39.000000      N/A     Disabled
888     1028    wscntfy.exe     0xff364310      1       27      0       False   2010-08-11 06:06:49.000000      N/A     Disabled
1084    1968    TPAutoConnect.e 0xff38b5f8      1       61      0       False   2010-08-11 06:06:52.000000      N/A     Disabled
1724    1708    explorer.exe    0xff3865d0      11      294     0       False   2010-08-11 06:09:29.000000      N/A     Disabled
432     1724    VMwareTray.exe  0xff3667e8      1       49      0       False   2010-08-11 06:09:31.000000      N/A     Disabled
452     1724    VMwareUser.exe  0xff374980      5       176     0       False   2010-08-11 06:09:32.000000      N/A     Disabled
468     1028    wuauclt.exe     0x80f94588      3       130     0       False   2010-08-11 06:09:37.000000      N/A     Disabled
1136    1724    ImmunityDebugge 0xff37a4b0      2       73      0       False   2010-08-11 16:50:19.000000      N/A     Disabled

PS D:\Application\volatility3-stable> python .\vol.py -f D:\book\malwarecookbook-master\malwarecookbook-master\15\6\prolaco.vmem\prolaco.vmem windows.psscan
Volatility 3 Framework 2.4.1
Progress:  100.00               PDB scanning finished
PID     PPID    ImageFileName   Offset(V)       Threads Handles SessionId       Wow64   CreateTime      ExitTime        File output

1260    1724    rundll32.exe    0x5f23a0        0       -       0       False   2010-08-11 16:50:29.000000      2010-08-11 16:50:42.000000      Disabled  ==》如果是退出的进程,这里是可以看到的
468     1028    wuauclt.exe     0x10f7588       3       130     0       False   2010-08-11 06:09:37.000000      N/A     Disabled
1028    676     svchost.exe     0x1122910       63      1334    0       False   2010-08-11 06:06:24.000000      N/A     Disabled
1336    1136    1_doc_RCData_61 0x113f648       1       24      0       False   2010-08-11 16:50:20.000000      N/A     Disabled ==》这个就是那个隐藏的进程了!
856     676     svchost.exe     0x115b8d8       16      198     0       False   2010-08-11 06:06:24.000000      N/A     Disabled
4       0       System  0x1214660       56      253     N/A     False   N/A     N/A     Disabled
1968    676     TPAutoConnSvc.e 0x211ab28       5       100     0       False   2010-08-11 06:06:39.000000      N/A     Disabled
1084    1968    TPAutoConnect.e 0x49c15f8       1       61      0       False   2010-08-11 06:06:52.000000      N/A     Disabled
1724    1708    explorer.exe    0x4a065d0       11      294     0       False   2010-08-11 06:09:29.000000      N/A     Disabled
1136    1724    ImmunityDebugge 0x4a544b0       2       73      0       False   2010-08-11 16:50:19.000000      N/A     Disabled
452     1724    VMwareUser.exe  0x4b5a980       5       176     0       False   2010-08-11 06:09:32.000000      N/A     Disabled
432     1724    VMwareTray.exe  0x4be97e8       1       49      0       False   2010-08-11 06:09:31.000000      N/A     Disabled
888     1028    wscntfy.exe     0x4c2b310       1       27      0       False   2010-08-11 06:06:49.000000      N/A     Disabled
544     4       smss.exe        0x5471020       3       21      N/A     False   2010-08-11 06:06:21.000000      N/A     Disabled
216     676     alg.exe 0x5f027e0       6       104     0       False   2010-08-11 06:06:39.000000      N/A     Disabled
688     632     lsass.exe       0x5f47020       19      341     0       False   2010-08-11 06:06:24.000000      N/A     Disabled
676     632     services.exe    0x6015020       16      269     0       False   2010-08-11 06:06:24.000000      N/A     Disabled
1088    676     svchost.exe     0x61ef558       4       75      0       False   2010-08-11 06:06:25.000000      N/A     Disabled
844     676     vmacthlp.exe    0x6384230       1       24      0       False   2010-08-11 06:06:24.000000      N/A     Disabled
936     676     svchost.exe     0x63c5560       9       256     0       False   2010-08-11 06:06:24.000000      N/A     Disabled
1144    420     msiexec.exe     0x640ac10       0       -       0       False   2010-08-11 16:49:33.000000      2010-08-11 16:50:08.000000      Disabled  ==》也是退出的进程!可以pass掉!
1148    676     svchost.exe     0x6499b80       14      207     0       False   2010-08-11 06:06:26.000000      N/A     Disabled
1788    676     VMUpgradeHelper 0x655fc88       3       97      0       False   2010-08-11 06:06:38.000000      N/A     Disabled
632     544     winlogon.exe    0x66f0978       19      565     0       False   2010-08-11 06:06:23.000000      N/A     Disabled
608     544     csrss.exe       0x66f0da0       11      349     0       False   2010-08-11 06:06:23.000000      N/A     Disabled
1432    676     spoolsv.exe     0x6945da0       13      135     0       False   2010-08-11 06:06:26.000000      N/A     Disabled
1668    676     vmtoolsd.exe    0x69d5b28       5       219     0       False   2010-08-11 06:06:35.000000      N/A     Disabled
可以看到psscan和pslist的比较即可发现隐藏的恶意进程,还是非常好用的!!!
此外,书里还提到了其他的识别隐藏进程的方法,作者还是很厉害的!

最后,我们继续分析下那个恶意软件prolaco,
从内存中dump出PE文件:
PS D:\Application\volatility3-stable> python .\vol.py -f D:\book\malwarecookbook-master\malwarecookbook-master\15\6\prolaco.vmem\prolaco.vmem windows.psscan --pid 1336 --dump
Volatility 3 Framework 2.4.1
Progress:  100.00               PDB scanning finished
PID     PPID    ImageFileName   Offset(V)       Threads Handles SessionId       Wow64   CreateTime      ExitTime        File output

1336    1136    1_doc_RCData_61 0x113f648       1       24      0       False   2010-08-11 16:50:20.000000      N/A     pid.1336.0x400000.dmp
注意,如果是pslist的话,dump不出来任何东西,因为他找不到1336的pid,所以要使用psscan。
PS D:\Application\volatility3-stable> python .\vol.py -f D:\book\malwarecookbook-master\malwarecookbook-master\15\6\prolaco.vmem\prolaco.vmem windows.psscan -h
Volatility 3 Framework 2.4.1
usage: volatility windows.psscan.PsScan [-h] [--pid [PID ...]] [--dump] [--physical]

options:
  -h, --help       show this help message and exit
  --pid [PID ...]  Process ID to include (all other processes are excluded)
  --dump           Extract listed processes
  --physical       Display physical offset instead of virtual
dump出PE以后,使用ida打开:

dump出来以后,计算md5然后再vt里查询下情报,如下:
PS D:\Application\volatility3-stable> md5deep .\pid.1336.0x400000.dmp
md5deep.exe: WARNING: You are running a 32-bit program on a 64-bit system.
md5deep.exe: You probably want to use the 64-bit version of this program.
7b0f17c2c2e3edc9b501406195d5d82c  D:\Application\volatility3-stable\pid.1336.0x400000.dmp
vt结果:

此外,如果是dump进程所有的内存,我看 https://security.stackexchange.com/questions/240041/how-to-dump-the-memory-of-a-given-process-with-volatility-3 这里面说的如下方法,但是实际上在我这里没有生效。但是记录下:
To dump the whole memory (not only binary itself) of the given process in Volatility 3 you need to use windows.memmap.Memmap plugin with --pid and --dump options as explained here.
For example:
vol.py -f mydump.vmem -o /path/to/output/dir windows.memmap.Memmap --pid 1233 --dump
PS D:\Application\volatility3-stable> python .\vol.py -f D:\book\malwarecookbook-master\malwarecookbook-master\15\6\prolaco.vmem\prolaco.vmem windows.memmap --pid 1336 --dump
Volatility 3 Framework 2.4.1
Progress:  100.00               PDB scanning finished
Virtual Physical        Size    Offset in File  File output
可以看到结果为空。

 浙公网安备 33010602011771号