python多进程map用户 scatter绘图 make_blobs聚类数据生成
python multiprocessing
map(func,iterable [,chunksize ] )
map()内置函数的并行等价物(尽管它只支持一个可迭代的参数)。它会阻塞,直到结果准备就绪。此方法将iterable内的每一个对象作为单独的任务提交给进程池。可以通过将chunksize设置为正整数来指定这些块的(近似)大小。
from multiprocessing import Pool
def test(i):
print(i)
if __name__ == "__main__":
lists = [1, 2, 3]
pool = Pool(processes=2) #定义最大的进程数
pool.map(test, lists) #p必须是一个可迭代变量。
pool.close()
pool.join()
-----------------------------------
©著作权归作者所有:来自51CTO博客作者Python热爱者的原创作品,请联系作者获取转载授权,否则将追究法律责任
python学习:multiprocessing多进程-Pool进程池模块
https://blog.51cto.com/u_14246112/5730105
Searching Arrays
You can search an array for a certain value, and return the indexes that get a match.
To search an array, use the where() method.
Example
Find the indexes where the value is 4:
import numpy as np
arr = np.array([1, 2, 3, 4, 5, 4, 4])
x =
np.where(arr == 4)
print(x)
The example above will return a tuple: (array([3, 5, 6],)
Which means that the value 4 is present at index 3, 5, and 6.
Example
Find the indexes where the values are even:
import numpy as np
arr = np.array([1, 2, 3, 4, 5, 6, 7, 8])
x =
np.where(arr%2 == 0)
print(x)
python scatter绘图 举个示例
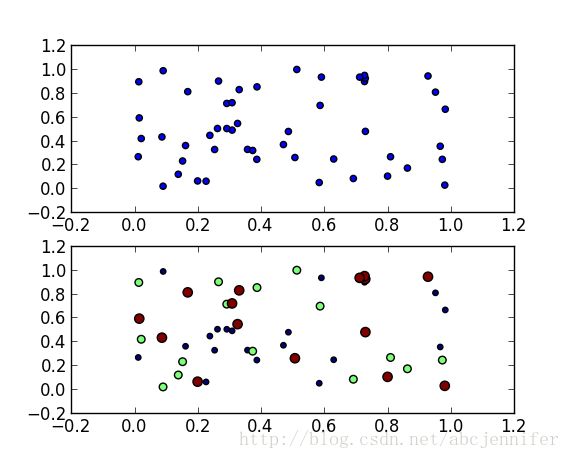
本文记录了python中的数据可视化——散点图scatter,令x作为数据(50个点,每个30维),我们仅可视化前两维。labels为其类别(假设有三类)。
这里的x就用random来了,具体数据具体分析。
label设定为[1:20]->1, [21:35]->2, [36:50]->3,(python中数组连接方法:先强制转为list,用+,再转回array)
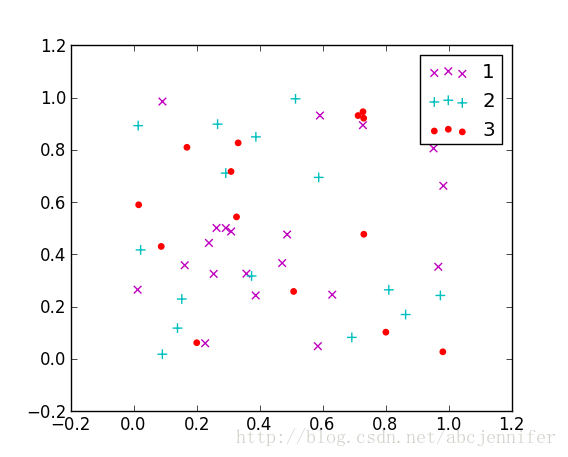
用matplotlib的scatter绘制散点图,legend和matlab中稍有不同,详见代码。
1
2
3
4
5
6
7
8
9
10
11
12
13
14
15
16
17
18
19
20
21
22
23
24
25
x = rand(50,30)
from numpy import *
import matplotlib
import matplotlib.pyplot as plt
#basic
f1 = plt.figure(1)
plt.subplot(211)
plt.scatter(x[:,1],x[:,0])
# with label
plt.subplot(212)
label = list(ones(20))+list(2*ones(15))+list(3*ones(15))
label = array(label)
plt.scatter(x[:,1],x[:,0],15.0*label,15.0*label)
# with legend
f2 = plt.figure(2)
idx_1 = find(label==1)
p1 = plt.scatter(x[idx_1,1], x[idx_1,0], marker = 'x', color = 'm', label='1', s = 30)
idx_2 = find(label==2)
p2 = plt.scatter(x[idx_2,1], x[idx_2,0], marker = '+', color = 'c', label='2', s = 50)
idx_3 = find(label==3)
p3 = plt.scatter(x[idx_3,1], x[idx_3,0], marker = 'o', color = 'r', label='3', s = 15)
plt.legend(loc = 'upper right')
result:
figure(1):
![]()
figure(2):
![]()
sklearn中的make_blobs函数主要是为了生成数据集的,具体如下:
调用make_blobs
make_blobs的用法
data, label = make_blobs(n_features=2, n_samples=100, centers=3, random_state=3, cluster_std=[0.8, 2, 5])
- n_features表示每一个样本有多少特征值
- n_samples表示样本的个数
- centers是聚类中心点的个数,可以理解为label的种类数
- random_state是随机种子,可以固定生成的数据
- cluster_std设置每个类别的方差
![]()


 浙公网安备 33010602011771号