
- 安装xdebug: https://xdebug.org/docs/install#windows(in my case: xdebug version: 3.x. PHP version:7.2.x platform: windows 10. environment: phpstudy)
- config PHP refer to : https://deliciousbrains.com/xdebug-advanced-php-debugging/#xdebug-3 下面是个简单配置的例子. zend_extension路径替换为实际的放置PHP xdebug扩展所在的路径。
[xdebug]
zend_extension="/path/to/xdebug.dll"
xdebug.mode=debug
xdebug.client_host=127.0.0.1
xdebug.client_port="9003"
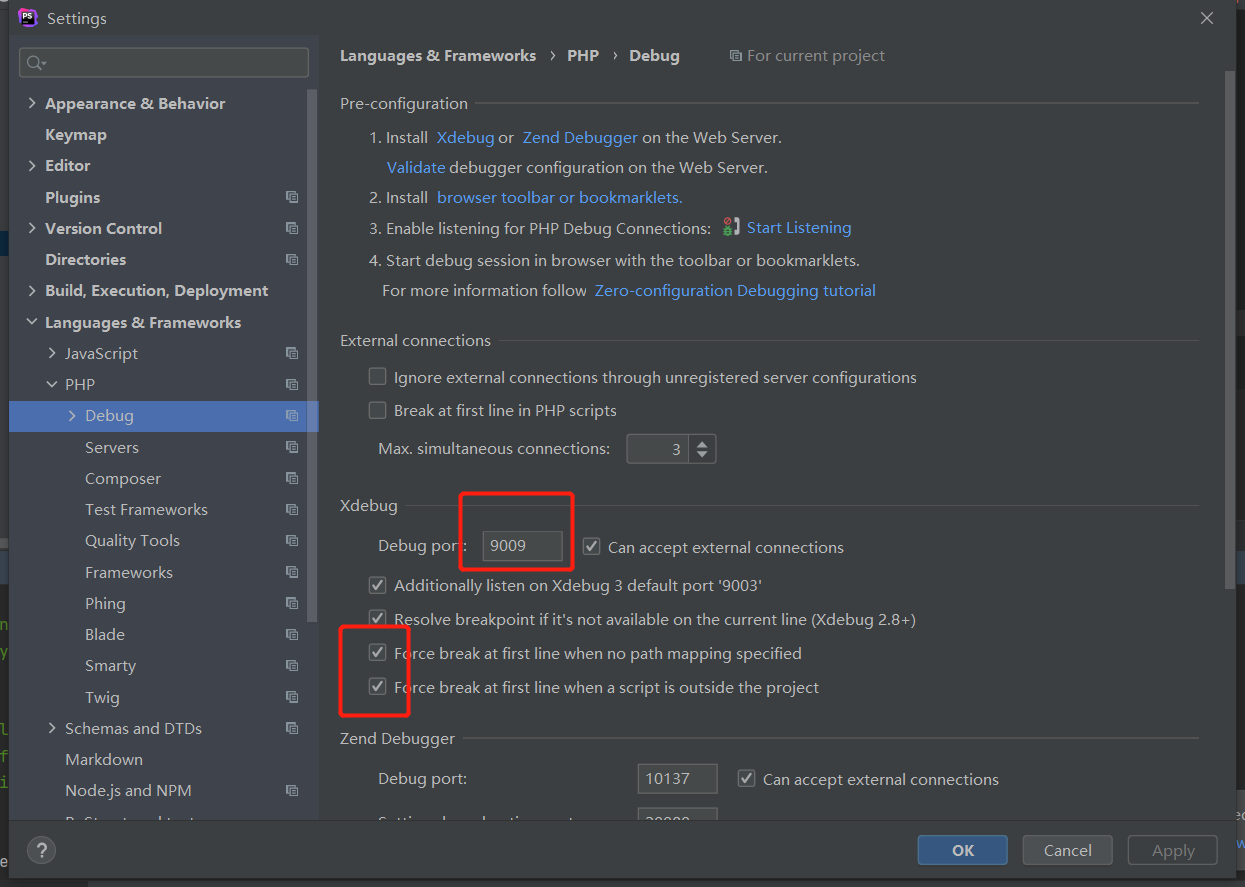
- 配置PHP storm:在PHP storm界面按下:CTRL+alt+s 弹出配置界面,在xdebug 部分,Debug port 改为上面xdebug.client_port相同端口(9003)如下图红框部分(勾选上)
![]()
- 添加chrome 插件方便我们在浏览器中使用,google搜索xdebug helper,添加至chrome中即可。
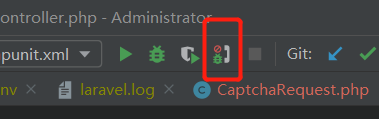
- 使用:在PHP storm中开启“start listening for PHP debug connections” 一个电话的图标
![]()
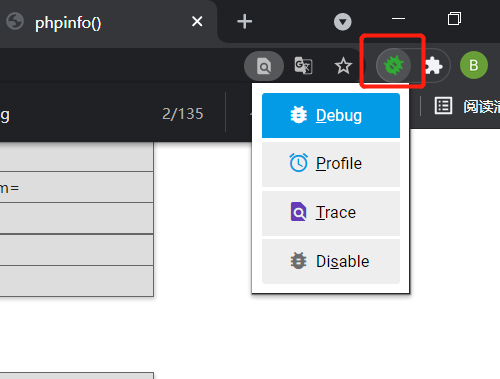
浏览器中开启方式:默认disable,点击debug开启
![]()
之后就可以使用了。 - 参考:https://deliciousbrains.com/xdebug-advanced-php-debugging/
https://xdebug.org/docs/all_settings

 浙公网安备 33010602011771号