matplotlib库笔记1
1、matplotlib.pyplot中add_subplot方法
import matplotlib.pyplot as plt
from numpy import *
fig = plt.figure()
ax = fig.add_subplot(349)
ax.plot(x,y)
plt.show()
参数349的意思是:将画布分割成3行4列,图像画在从左到右从上到下的第9块,如下图:

那第十块怎么办,3410是不行的,可以用另一种方式(3,4,10)。
2、用matplotlib库完整的画出图形
from numpy import *
import matplotlib
import matplotlib.pyplot as plt
from matplotlib.patches import Circle
fig = plt.figure()#生成一个640*420的画布
ax = fig.add_subplot(111)#画布分成一行一列,图片在第一块
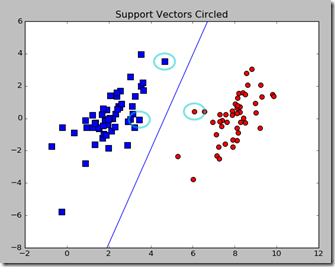
ax.scatter(xcord0,ycord0, marker='s', s=90)#在坐标系中画点,前两个参数为点坐标,marker=s为方形,s=90为大小,c=red为坐标颜色
ax.scatter(xcord1,ycord1, marker='o', s=50, c='red')
plt.title('Support Vectors Circled')
#坐标表示要画圈的地方,第二个参数表示圈的大小,faceclolor表示,edgecolor表示圈的颜色值,linewidth表示圈的线条粗细,alpha表示颜色深浅
circle = Circle((4.6581910000000004, 3.507396), 0.5, facecolor='none', edgecolor=(0,0.8,0.8), linewidth=3, alpha=0.5)
ax.add_patch(circle)

b = -3.75567; w0=0.8065; w1=-0.2761#已经训练好的参数
x = arange(-2.0, 12.0, 0.1)
y = (-w0*x - b)/w1
ax.plot(x,y)#画出直线
ax.axis([-2,12,-8,6])#设置坐标轴,-2~12位横轴;-8~6位纵轴
plt.show()


