简单封装echarts饼图实现的设计图效果

设计图效果
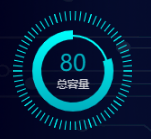


 封装组件

<template>
  <div class="gauge" ref="chart"></div>
</template>

<script>
  export default {
    name: 'DrawGauge',
    data() {
      return {
        colorSource: [
          ['rgba(0, 255, 252, 1)', 'rgba(0, 174, 190, 1)'],
          ['rgba(252, 186, 98, 1)', 'rgba(249, 63, 0, 1)'],
          ['rgba(0, 174, 255, 1)', 'rgba(17, 102, 255, 1)'],
          ['rgba(214, 235, 255, 1)', 'rgba(176, 210, 242, 1)'],
        ]
      }
    },
    props: {
      color: {
        type: Number,
        default: 0 // 类型 0 1 2 3
      },
    },
    methods: {
      drawGauge() {
        let myChart = this.$echarts.init(this.$refs.chart)
        let option = {
          series: [{
              type: 'gauge',
              startAngle: -360,
              endAngle: -270,
              radius: 45,
              z: 2,
              clockwise: false,
              pointer: {
                show: false
              },
              progress: {
                show: true,
                overlap: true,
                roundCap: false,
                clip: false,
                itemStyle: {
                  color: {
                    type: 'linear',
                    x: 0,
                    y: 0,
                    x2: 0,
                    y2: 1,
                    colorStops: [{
                      offset: 0,
                      color: this.colorSource[this.color][0] // 0% 处的颜色
                    }, {
                      offset: 1,
                      color: this.colorSource[this.color][1] // 100% 处的颜色
                    }],
                    global: false // 缺省为 false
                  }
                },
              },
              axisLine: {
                show: false,
                lineStyle: {
                  width: 10
                }
              },
              splitLine: {
                show: false,
                distance: 0,
                length: 10
              },
              axisTick: {
                show: false
              },
              axisLabel: {
                show: false,
                distance: 50
              },
              data: [{
                value: 80,
                name: '总容量',
                title: {
                  offsetCenter: ['0%', '35%']
                },
                detail: {
                  valueAnimation: true,
                  offsetCenter: ['0%', '-15%']
                }
              }],
              title: {
                fontSize: 12,
                textStyle: {
                  color: 'rgba(255,255,255,0.8)'
                }
              },
              detail: {
                width: 50,
                height: 14,
                fontSize: 25,
                fontWeight: 400,
                color: 'auto',
                textStyle: {
                  color: this.colorSource[this.color][1]
                },
                formatter: '{value}'
              }
            },
            {
              type: 'gauge',
              startAngle: 90,
              endAngle: -270,
              z: 1,
              radius: 40,
              pointer: {
                show: false
              },
              progress: {
                show: true,
                overlap: true,
                roundCap: false,
                clip: false,
                itemStyle: {
                  color: this.colorSource[this.color][0]
                },
                width: 2
              },
              axisLine: {
                show: false,
                lineStyle: {
                  width: 2
                }
              },
              splitLine: {
                show: false,
                distance: 0,
                length: 10
              },
              axisTick: {
                show: false
              },
              axisLabel: {
                show: false,
                distance: 50
              },
              data: [{
                value: 100,
                name: 'Commonly',
                title: {
                  show: false,
                  offsetCenter: ['0%', '30%']
                },
                detail: {
                  show: false,
                  valueAnimation: true,
                  offsetCenter: ['0%', '40%']
                }
              }],
            },
            {
              type: 'gauge',
              radius: 77,
              startAngle: 0,
              endAngle: 360,
              axisLine: {
                show: false,
                lineStyle: {
                  width: 1,
                  opacity: 0
                }
              },
              title: {
                show: false
              },
              detail: {
                show: false
              },
              splitLine: {
                show: false
              },
              axisTick: {
                length: 10,
                splitNumber: 7,
                lineStyle: {
                  color: this.colorSource[this.color][0],
                  width: 1
                }
              },
              axisLabel: {
                show: false
              },
              pointer: {
                show: false
              },
              itemStyle: {},
              data: [{
                value: 20,
              }]
            }
          ]
        };
        myChart.setOption(option)
        window.onresize = function () {
          myChart.resize();
        };
      }
    },
    mounted() {
      this.drawGauge()
    },
  }
</script>

<style>
  .gauge {
    height: 132px;
    width: 132px;
    margin-top: 20px;
  }
</style>

组件在页面内调用

<draw-gauge :color="0"></draw-gauge>

实现此效果,当然也可以切图垫底,只绘制中间的饼图,使用图片做底部实现效果

posted @ 2022-01-10 10:26  又拿代码换酒钱  阅读(99)  评论(0编辑  收藏  举报