[Echarts]用Echarts绘制饼状图
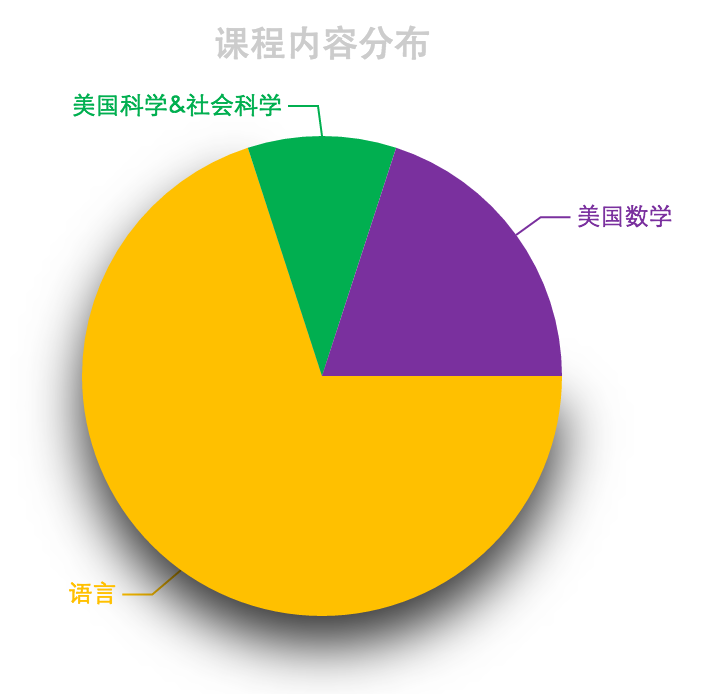
在项目网站的网页中,有这样一幅图:

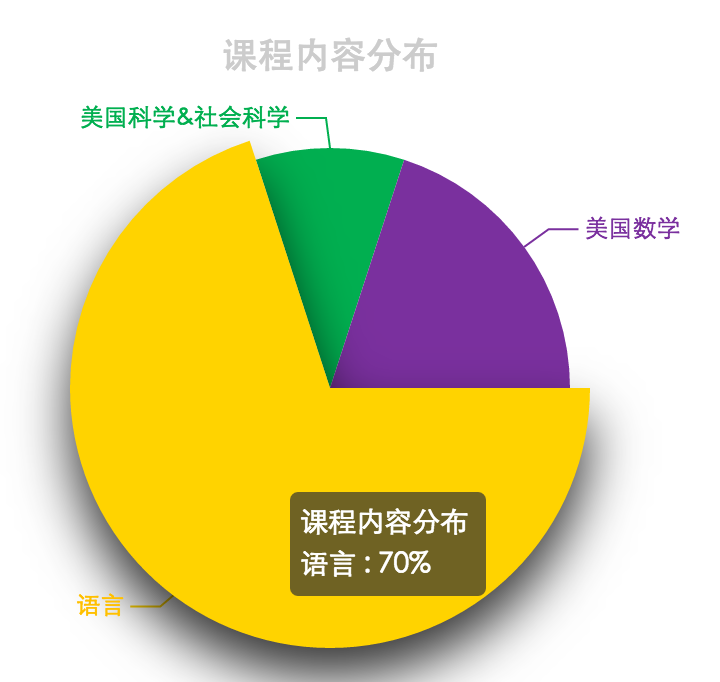
心血来潮,想使用百度Echarts来绘制一下,可是没能绘制得完全一样,Echarts饼状图的label不能在图形下面放成一行,最后的效果是这样子的:

鼠标移动到items上,可动态显示百分比:

另外,还了解到了一种特殊的饼状图:南丁格尔图,就是用扇形半径的大小来表示百分比,对于相差比较大的items,看起来会有些不平衡;
最后,上代码:
 1 <!DOCTYPE html>
 2 <html>
 3 <head>
 4     <meta charset="UTF-8">
 5     <title>饼状图练习</title>
 6     <style>
 7         #pic1{
 8             width:400px;
 9             height:400px;
10             margin: 20px auto;
11         }
12     </style>
13     <script src="js/echarts.common.min.js"></script>
14 </head>
15 <body>
16     <div id="pic1"></div>
17 <script>
18     var myCharts1 = echarts.init(document.getElementById('pic1'));
19     var option1 = {
20         backgroundColor: 'white',
21
22         title: {
23             text: '课程内容分布',
24             left: 'center',
25             top: 20,
26             textStyle: {
27                 color: '#ccc'
28             }
29         },
30         tooltip : {
31             trigger: 'item',
32             formatter: "{a} <br/>{b} : {d}%"
33         },
34
35         visualMap: {
36             show: false,
37             min: 500,
38             max: 600,
39             inRange: {
40                 colorLightness: [0, 1]
41             }
42         },
43         series : [
44             {
45                 name:'课程内容分布',
46                 type:'pie',
47                 clockwise:'true',
48                 startAngle:'0',
49                 radius : '60%',
50                 center: ['50%', '50%'],
51                 data:[
52                     {
53                         value:70,
54                         name:'语言',
55                         itemStyle:{
56                             normal:{
57                                 color:'rgb(255,192,0)',
58                                 shadowBlur:'90',
59                                 shadowColor:'rgba(0,0,0,0.8)',
60                                 shadowOffsetY:'30'
61                             }
62                         }
63                     },
64                     {
65                         value:10,
66                         name:'美国科学&社会科学',
67                         itemStyle:{
68                             normal:{
69                                 color:'rgb(1,175,80)'
70                             }
71                         }
72                     },
73                     {
74                         value:20,
75                         name:'美国数学',
76                         itemStyle:{
77                             normal:{
78                                 color:'rgb(122,48,158)'
79                             }
80                         }
81                     }
82
83                 ],
84             }
85         ]
86     };
87     myCharts1.setOption(option1);
88 </script>
89 </body>
90 </html>


