FusionCharts和highcharts 饼图区别!
FusionCharts
---------------脚本---------------
<script src="../../../fashioncharts/js/FusionCharts.js" type="text/javascript"></script>
---------html----------
<div id="container"> </div>
-----------------------js-----------------------
$.ajax({
                url: BasinList.url
                    , async: true
                    , dataType: "json"
                    , data: {
                        Method: "GetChartsData",
                        datatype: BasinList.datatype,
                        starttime: BasinList.starttime,
                        endtime: BasinList.endtime,
                        selType: BasinList.selType,
                        seltypeBR: BasinList.seltypeBR,
                        CategoryList1: BasinList.CategoryList1,
                        dbRadioVal: BasinList.dbRadioVal,
                        DBStarTime: BasinList.DBStarTime,
                        DBEndTime: BasinList.DBEndTime,
                        charttype: type
                    }
            }).done(function (data) {

                //                var list1 = data;
                $.messager.progress('close');
                //属性http://blog.sina.com.cn/s/blog_5384392701011srl.html
                var dataxml = '<chart caption="" legendborderalpha="0" startingangle="45"  slicingdistance="20"'; //slicingdistance:点击pie时 移动距离
                dataxml += 'basefontColor="000000" showlegend="1" chartLeftMargin="0" chartTopMargin="0" chartBottomMargin="1" baseFontSize="15"';
                dataxml += 'legendBgAlpha="0" bgAlpha="0" bgSWFAlpha="0"';
                dataxml += 'toolTipBorderColor="#9BD7F5" showpercentvalues="1" showpercentintooltip="0" plottooltext="$value: $label"'//提示框样式与格式设置
                dataxml += 'palettecolors="#8DEE93,#0098d9,#E42B6D,#05AD06">'; //指定各个pie区颜色
                $.each(data, function (i, item) {
                    dataxml += '<set label="' + item.name + '" value="' + item.y + '" />';
                });
                dataxml += '</chart>';
                var myChart = new FusionCharts("../../..//fashioncharts/swf/Pie3D.swf", "myChart", "100%", "60%", "0", "0");
                myChart.setDataXML(dataxml);
                myChart.render("container");
 });
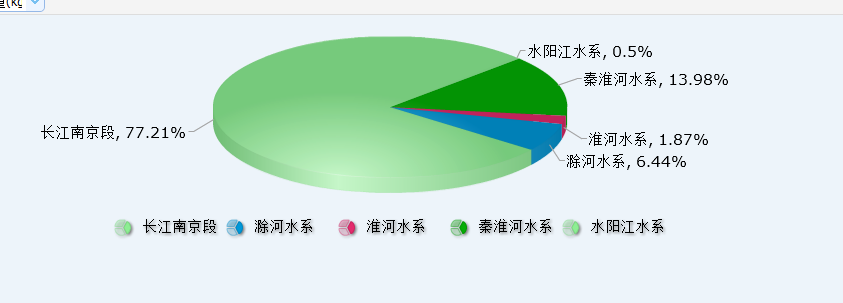
效果图片----------------------
------------------------highcharts------------
------------------js---------------
    <script type="text/javascript" src="../../../Highstock/js/highstock.js"></script>
    <script type="text/javascript" src="../../../Highstock/js/highcharts-3d.js"></script>
===========================================================================
$('#container').highcharts({
                                    chart: {
                                        type: 'pie',
                                        options3d: {
                                            enabled: true,
                                            alpha: 30,
                                            beta: 0
                                        }
                                    },
                                    credits: {
                                        enabled: false //是否显示highcharts.com标识
                                    },
                                    loading: {//正在加载提示
                                        style: {
                                            backgroundColor: 'silver'
                                        },
                                        labelStyle: {
                                            color: 'white'
                                        }
                                    },
                                    title: {
                                        text: ''
                                    },
                                    tooltip: {
                                        pointFormat: '{series.name}: <b>{point.percentage:.1f}%</b>'
                                    },
                                    plotOptions: {
                                        pie: {
                                            allowPointSelect: true,
                                            cursor: 'pointer',
                                            depth: 35, //3D pie
                                            dataLabels: {
                                                enabled: true,
                                                format: '<b>{point.name}</b>: {point.percentage:.1f} %',
                                                style: {
                                                    color: (Highcharts.theme && Highcharts.theme.contrastTextColor) || 'black'
                                                }
                                            },
                                            showInLegend: true
                                        }
                                    },
                                    legend: {
                                        layout: 'vertical',
                                        align: 'right',
                                        verticalAlign: 'top',
                                        x: -30,
                                        y: 40,
                                        floating: true,
                                        borderWidth: 1,
                                        backgroundColor: ((Highcharts.theme && Highcharts.theme.legendBackgroundColor) || '#FFFFFF'),
                                        shadow: true,
                                        itemStyle: {
                                            "fontSize": "12px",
                                            "fontWeight": "bold",
                                            "font-family": "微软雅黑"
                                        }
                                    },
                                    series: [{
                                        type: 'pie',
                                        name: '全市比例',
                                        data: list1
                                    }]
                                });
效果图

看个人喜欢吧!FusionCharts 加载慢一点,falsh原因吧!
转载:http://www.cnblogs.com/blue123/p/6236240.html

 浙公网安备 33010602011771号