C35 空气污染和暴露其中的人口(Part 7)
导读
在过去的几十年里,我们越来越多地接触到一系列监测地球大气成分的卫星传感器。然而,重要的是要注意,卫星测量的是对流层和平流层的污染物浓度,对流层和平流层在地球表面以上延伸许多公里。因此,卫星测量不一定代表人类在地面上接触到的浓度,因此不建议仅依靠卫星数据进行人类健康应用。然而,更复杂的方法将来自卫星遥感数据的信息、复杂的大气化学模型和地面监测仪相结合,以提供高可信度的地面污染物浓度。
主要内容
- 了解Sentinel-5P数据;
- 量化空气污染物浓度随时间的变化;
- 计算人口加权空气污染物浓度。
Section 1 数据导入与清洗
- 在GEE中有一系列基于卫星的空气污染数据集可供选择。
- Sentinel-5 于2017年10月发射,但是数据最早是2018年7月才可以用。
- TROPMI是Sentinel-5 卫星携带的传感,可以感应紫外线(ultraviolet)可见光(visible), 近红外(near-infrared), 短波红外(shortwave infrared wavelengths);
- 可用来监测大气中的NO2, O3, aerosol(气溶胶), methane (CH4), formaldehyde(甲醛),CO, and SO2 ;
- TROPOMI在地面上的条带宽度约为2600公里,可实现7 × 7公里的空间分辨率的全球日覆盖;
- 除CH4外,所有Sentinel-5P数据集都有两个版本:近实时(NRTI)和离线(OFFL);CH4仅有OFFL可用。
示例使用OFFL NO2产品。
代码中涉及到的数据集:
人口数量和密度数据集:(世界第 4 版网格化人口 (GPWv4) 修订版30 弧秒1公里格网)CIESIN/GPWv411/GPW_Population_Count;
(GEE中还有两个人口数据集 WorldPop和Global Human Settlement Layers)
全球行政单位层(GAUL)国家-省/州层面数据集:FAO/GAUL_SIMPLIFIED_500m/2015/level1
// 导入GAUL全球行政单元 1级产品
var adminUnits = ee.FeatureCollection( 'FAO/GAUL_SIMPLIFIED_500m/2015/level1');

// 根据自定义的(武汉)区域选择GAUL图层
var adminSelect = adminUnits.filterBounds(geometry);

// Center the map on this area.
Map.centerObject(adminSelect, 7);

// 设置地图显示选项指定了地图的底图样式。
//'HYBRID' 选项将地图显示为混合模式,即卫星图像和地图图层的组合.
//结合了卫星影像和地理信息,如道路、地名等
Map.setOptions('HYBRID');

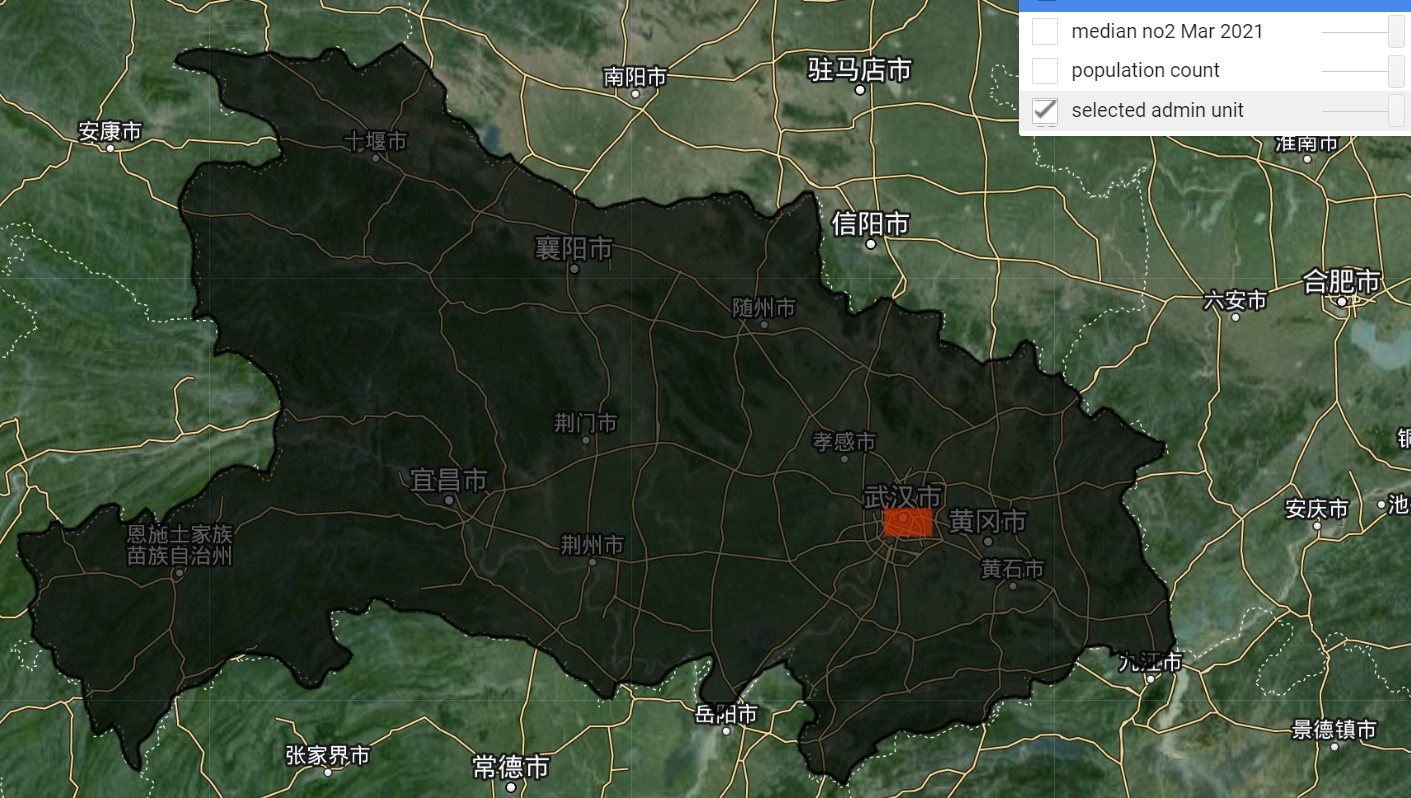
Map.addLayer(adminSelect, {}, 'selected admin unit');

// 导入人口统计数据 Gridded Population of the World Version 4.
var population = ee.ImageCollection( 'CIESIN/GPWv411/GPW_Population_Count')
    // Filter for 2020 using the calendar range function.
    .filter(ee.Filter.calendarRange(2020, 2020, 'year'))
    // There should be only 1 image, but convert to an image using .mean().
    .mean();

// 根据区域裁剪人口数据
var populationClipped = population.clipToCollection(adminSelect);


// 将其添加到地图上以查看人口分布。
var popVis = {
    min: 0,
    max: 4000,
    palette: ['black', 'yellow', 'white'],
    opacity: 0.55
};
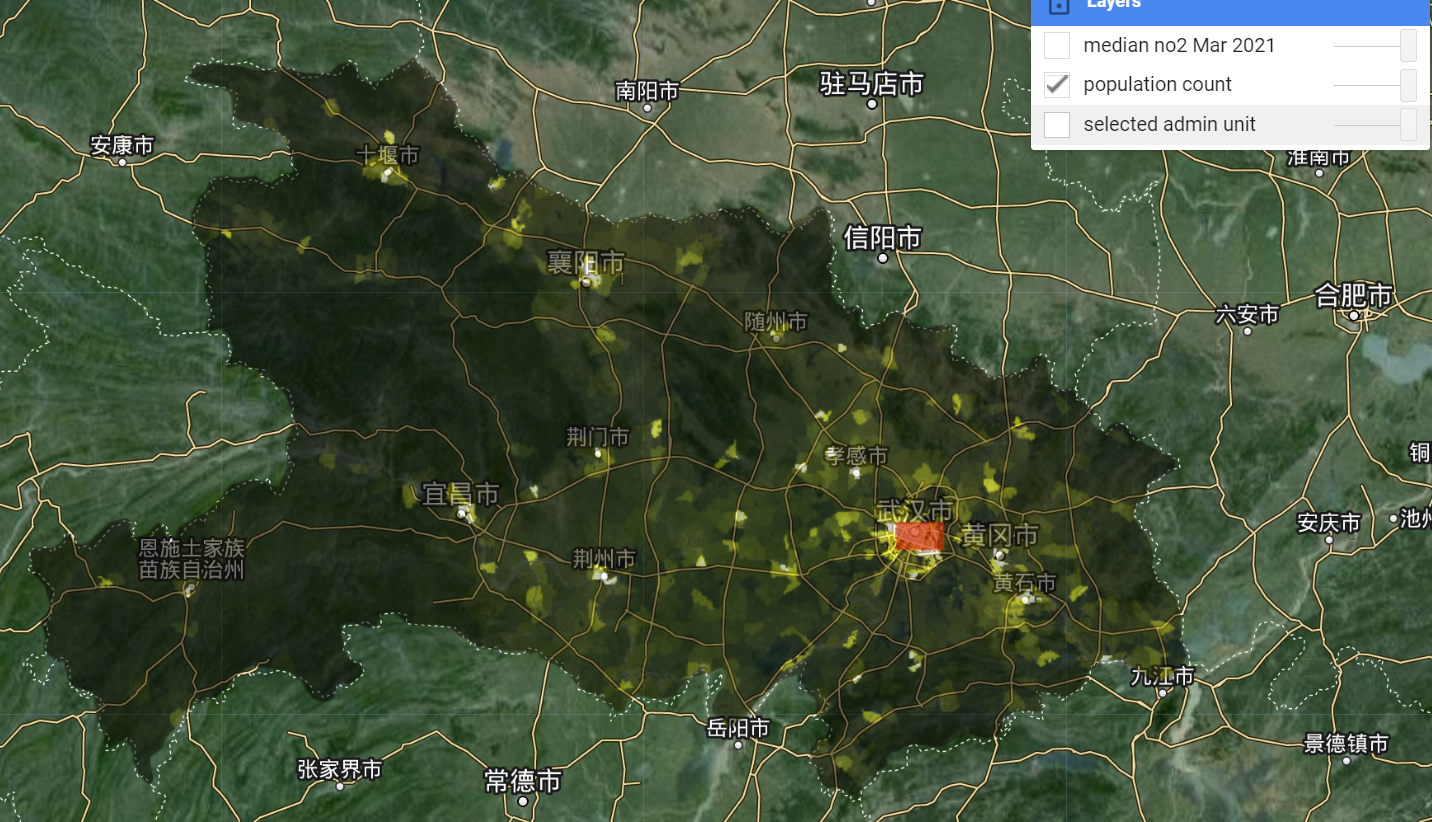
Map.addLayer(populationClipped, popVis, 'population count');


//=========================================================================================
//导入Sentinel-5P NO2离线产品
var no2Raw = ee.ImageCollection('COPERNICUS/S5P/OFFL/L3_NO2');

// 去云函数.
function maskClouds(image) {
    // Get the cloud fraction band of the image.
    var cf = image.select('cloud_fraction');
    // Create a mask using 0.3 threshold.
    var mask = cf.lte(0.3); // You can play around with this value.
    // Return a masked image.
    return image.updateMask(mask).copyProperties(image);
}

// Clean and filter the Sentinel-5P NO2 offline product.
var no2 = no2Raw
    .filterBounds(adminSelect)
    .map(maskClouds)
    .select('tropospheric_NO2_column_number_density');

// 创建2021年3月的中值合成影像
var no2Median = no2.filterDate('2021-03-01', '2021-04-01').median();


var no2MedianClipped = no2Median.clipToCollection(adminSelect);
// Visualize the median NO2.
var no2Viz = {
    min: 0,
    max: 0.00015,
    palette: ['black', 'blue', 'purple', 'cyan', 'green', 'yellow', 'red' ]
};
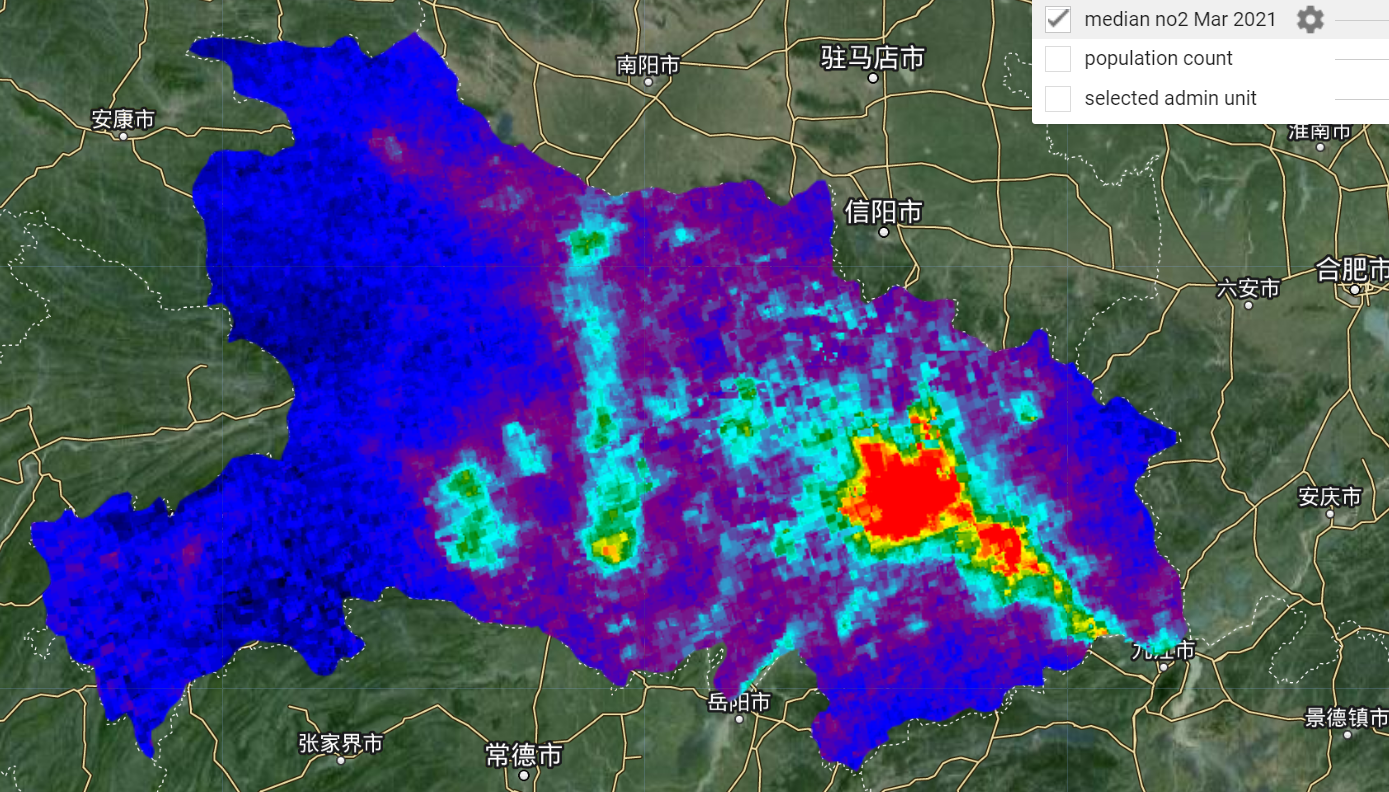
Map.addLayer(no2MedianClipped, no2Viz, 'median no2 Mar 2021');


Section 2 量化和可视化变化
测试一下看看我们是否能看到2020年COVID-19封锁期间二氧化氮浓度的变化。
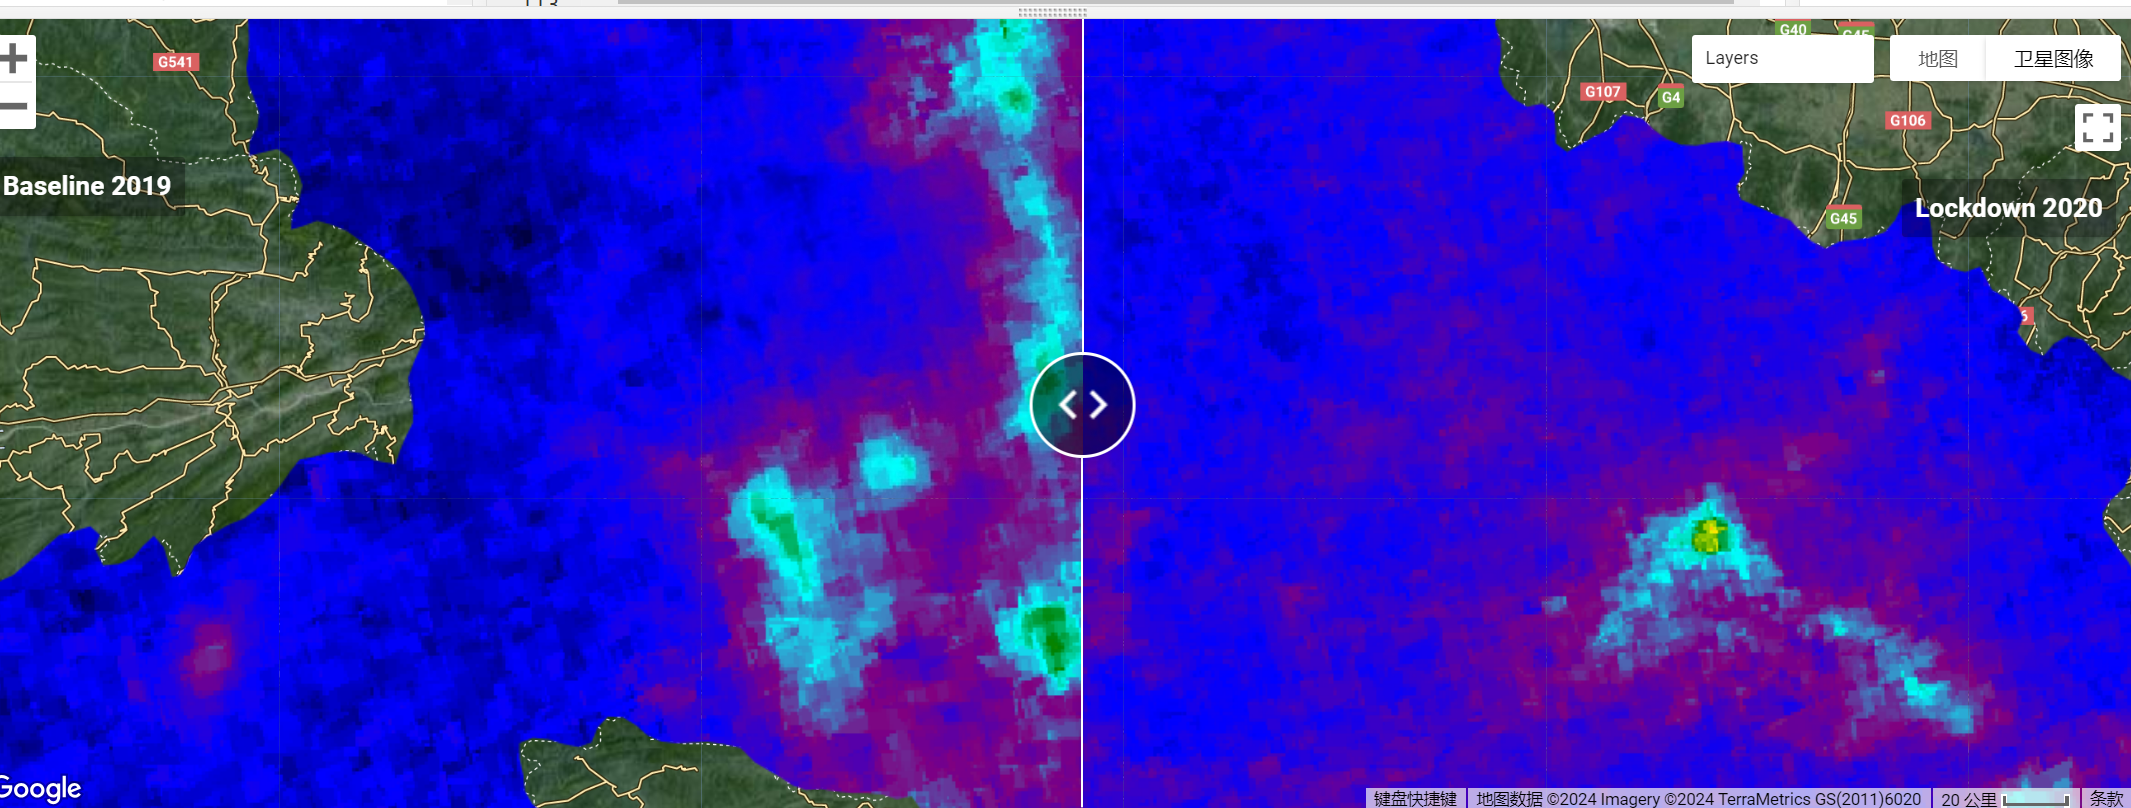
将2020年3月(湖北省封城期间)二氧化氮浓度中值与2019年3月的二氧化氮浓度中值进行比较。
// Define a lockdown NO2 median composite.
var no2Lockdown = no2.filterDate('2020-03-01', '2020-04-01')
    .median().clipToCollection(adminSelect);

// Define a baseline NO2 median using the same month in the previous year.
var no2Baseline = no2.filterDate('2019-03-01', '2019-04-01')
    .median().clipToCollection(adminSelect);

// Create a ui map widget to hold the baseline NO2 image.
var leftMap = ui.Map().centerObject(adminSelect, 8).setOptions( 'HYBRID');
// Create ta ui map widget to hold the lockdown NO2 image.
var rightMap = ui.Map().setOptions('HYBRID');

// Create a split panel widget to hold the two maps.
var sliderPanel = ui.SplitPanel({
    firstPanel: leftMap,
    secondPanel: rightMap,
    orientation: 'horizontal',
    wipe: true,
    style: {
        stretch: 'both'
    }
});

var linker = ui.Map.Linker([leftMap, rightMap]);

// Make a function to add a label with fancy styling.
function makeMapLab(lab, position) {
    var label = ui.Label({
        value: lab,
        style: {
            fontSize: '16px',
            color: '#ffffff',
            fontWeight: 'bold',
            backgroundColor: '#ffffff00',
            padding: '0px'
        }
    });

    var panel = ui.Panel({
        widgets: [label],
        layout: ui.Panel.Layout.flow('horizontal'),
        style: {
            position: position,
            backgroundColor: '#00000057',
            padding: '0px'
        }
    });
    return panel;
}

// Create baseline map layer, add it to the left map, and add the label.
var no2BaselineLayer = ui.Map.Layer(no2Baseline, no2Viz);
leftMap.layers().reset([no2BaselineLayer]);
leftMap.add(makeMapLab('Baseline 2019', 'top-left'));


// Create lockdown map layer, add it to the right map, and add the label.
var no2LockdownLayer = ui.Map.Layer(no2Lockdown, no2Viz);
rightMap.layers().reset([no2LockdownLayer]);
rightMap.add(makeMapLab('Lockdown 2020', 'top-right'));

// Reset the map interface (ui.root) with the split panel widget.
// Note that the Map.addLayer() calls earlier on in Section 1
// will no longer be shown because we have replaced the Map widget
// with the sliderPanel widget.
ui.root.widgets().reset([sliderPanel]);
对比分块图中的两幅图,发现封锁期间二氧化氮浓度有所下降


 浙公网安备 33010602011771号