2020年美国大学生数学建模比赛——C题论文
|
Problem Chosen |
2020 |
Team Control Number |
In this paper, we made a comprehensive product evaluation model, found the change in product reputation over time, predicted the future success or failure of the product, the impact of specific star ratings on subsequent product reviews, and the correlation between reviews sentiment score and star rating.
We first preprocess the given data set: delete irrelevant data and interfere data. And then process reviews body: delete non-text characters in the data, convert uppercase letters into lowercase, and correct the spelling errors. Based on the preprocessed data, we make a sentiment analysis on the reviews to get the sentiment score of each review. Then based on the number of product-related words in the review, the length of the review, the number of modifiers in the review, and the sentiment score of the review, we calculate the score of each review’s quality. Based on star rating, review quality score, and review sentiment score, we calculate the comprehensive score of each row in the data set by using the entropy method. Then we analyze the trend of the product's comprehensive score over time, that is, the change of product reputation over time. Based on the comprehensive score changes over time we predict the future success or failure of the product. Moreover, by analyzing the correlation between the inflection point's score on the comprehensive score-time curve and the average score of its previous period star rating, we believe that a specific star rating will not affect subsequent reviews. Besides, Based on the comment sentiment score calculated above, use correlation analysis to analyze whether the comment sentiment score has a strong correlation with the star rating of the comment.
Finally, we provide advice for Sunshine company to prepare their new products for online sale based on the models and rules that are explored. During the modeling process, we extract and filter related words related to the product in the review. For example, the feature words for hair dryers include xxx, xxx, and for baby pacifier are xxx, xxx. Obviously, these words extracted from the reviews are the important product characteristics which consumers value most, and also the direction that Sunshine needs to pay attention to when designing products.
In addition, for sunshine company, analyzing the historical data of competitors to predict the future direction of the product can help its new products to survive better in the market.
Content
Introduction. 3
Restatement of Problems. 3
General Defines. 4
Models and Algorithms. 4
Pre-process of Data. 5
Calculate Review’s Sentiment Score. 6
Calculate Review’s Quality Score. 6
The Relationship of Star Ratings, Reviews, and Helpfulness Ratings. 11
Comprehensive Evaluation Model (Most Informative Ratings and Reviews) 15
Product Reputation’s Change Over Time. 17
Product’s Future Success or Failure. 19
the Relationship Between Specific Star Ratings and Reviews. 19
the Relationship Between Quality Descriptors and Rating Levels in Reviews. 20
Introduction
Nowadays online shopping has become part of our lives. After shopping online, customer usually share their perspectives on the product they bought and the service they experienced, which are shown by star ratings and reviews. While shopping online, other customers can browse these stars and reviews, and give ratings on these reviews as being helpful or not, which called a helpfulness rating. For companies, these data give insight of markets they participate in, by analyzing the data, company can better hand customer’s preferences, therefore improve their products and services to gain a success in the future.
Sunshine Company is preparing to introduce and sell three new products in the online market: a microwave oven, a pacifier, and a hair dryer. Therefore, it wants to make an online marketing strategy and identify essential product design features that would enhance its competitiveness by analyzing the feedback of similar product of competing company.
To help Sunshine Company achieve its goals, we analyzed the given data sets and found patterns, relationships, measures etc. and provide Sunshine Company with suggestions for the products sale online in the future, hope it would be useful for Sunshine Company.
Restatement of Problems
The Sunshine Company requests us:
- Inform their online sales strategy
- Identify potentially important design features that would enhance product desirability
- Find the way these time-based data interact that will may help Sunshine company craft successful product.
In essence, this problem requires us to do 6 tasks:
- Find the ways the star ratings, reviews, and helpfulness ratings interact with each other.
- Identify most informative data measures based on ratings and reviews.
- Identify time-based measures and patterns that suggest a product’s reputation changes over time.
- Determine combinations of text-based measure(s) and ratings-based measures that best indicate a potentially successful or failing product.
- Figure out if specific star ratings incite more reviews.
- Figure out if specific quality descriptors of text-based reviews strongly associated with rating levels.
General Defines
Star rating: The 1 to 5star rating of the review.
Review: The review text
Helpful Votes: Number of helpful votes
Total Votes: Number of total votes the review received.
Helpful Vote Ratio (HVR): Helpful votes as a percentage of total votes. That is,
HVR =
Vine: Customers are invited to become Amazon Vine Voices based on the trust that they have earned in the Amazon community for writing accurate and insightful reviews. Amazon provides Amazon Vine members with free copies of products that have been submitted to the program by vendors. Amazon doesn't influence the opinions of Amazon Vine members, nor do they modify or edit reviews.
Verified Purchase: A “Y” indicates Amazon verified that the person writing the review purchased the product at Amazon and didn't receive the product at a deep discount.
Models and Algorithms
Pearson Correlation Coefficient: Pearson correlation coefficient s used to measure whether two data sets are on a line, and it is used to measure the linear relationship between distance variables.
The Entropy method: In information theory, entropy is a
measure of uncertainty. The greater the amount of information, the smaller the
uncertainty and entropy; the smaller the amount of information, the greater the
uncertainty and entropy. According to the characteristics of entropy, we can
judge the randomness and disorder of an event by calculating the entropy value,
and we can also use the entropy value to judge the degree of discreteness of an
indicator. The greater degree of dispersion of the indicator means the greater
impact it has on the comprehensive evaluation.
Therefore, the information entropy can be used to calculate the weight of each indicator according to the degree of variation of each indicator to provide a basis for comprehensive evaluation of multiple indicators.
TextBlob: TextBlob is a Python (2 and 3) library for processing textual data. It provides a simple API for diving into common natural language processing (NLP) tasks such as part-of-speech tagging, noun phrase extraction, sentiment analysis, classification, translation, and more.
Pre-process of Data

Picture-1 the process of Pre-process of data
Step-1: Remove irrelevant rows.
We find that the given data set has reviews that are not describe the product we analyze. By filtering the column product_title, that is, if column product_title in a row of data does not contain the word related to the analyzed product, we will delete the row.
Step-2: Remove rows that vine = ‘N’ and verified purchase = ‘N’
Non-vine and non-verified purchase reviews are not valid based on known conditions, as they cannot be confirmed the product has been used or received.
Step-3: Remove non-text from reviews
In this step we delete the non-text part of the review, which includes numbers, symbols, URLs, and certain specific characters, such as <br />.
Step-4: Case conversion of reviews
In this step we convert all capital letters in the review to lower case, for the convenience that we process the review later.
Step-5: Remove stop words from reviews
Stop words include words that often appear but have little meaning for classification, such as a, and, the, etc.
Step-6: Spell correction of reviews
We found that there were misspelled words in the reviews, for the convenience we process the review later, we give a spelling correction in this step.
Calculate Review’s Sentiment Score
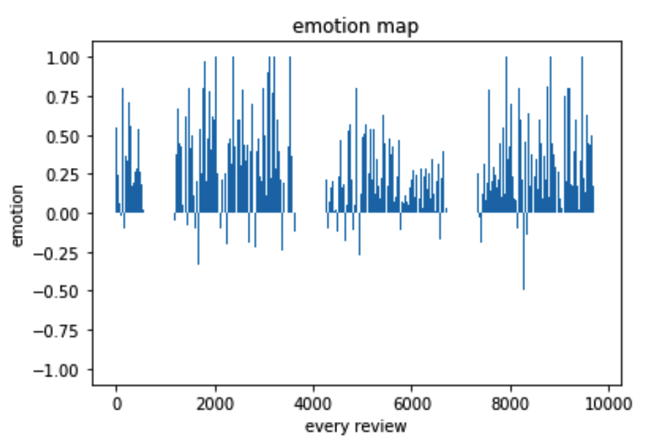
The sentiment score of a review is the sentiment index of the review, which is related to the sentiment words in the review. In order to get the sentiment index, we used the sentiment function in the TextBlob tool. The sentiment value is [-1,1]. Positive numbers represent positive feelings and negative numbers represent negative. The emotional distribution is as follows:
Picture-2 the emotion map
Calculate Review’s Quality Score
The quality of a review is an important description of a review. Based on experience and the data given, we picked seven indicators:
Score Indicators
|
Review Quantitative Rating Method |
||||||
|
indicators/ratings |
Scoring method |
score=1 |
score=2 |
score=3 |
score=4 |
|
|
vocabulary refers to the product |
Count of product-related words appearing in reviews |
|
|
|
|
|
|
the length of review |
Statistic comment length (measured by word length) |
|
|
|
|
|
|
Number of modifiers |
Number of modifiers |
|
|
|
|
|
|
helpful vote ratio |
Useful votes / All helpful votes |
|
|
|
|
|
|
Emotional expression intensity |
Counting sentiment scores in reviews |
|
|
|
|
|
|
Note 1: vine adds two points to Y |
Remark 2: 1 point plus for varified purchases |
|
|
|
|
|
Table-1 Review Quantitative Rating Method
Scoring criteria
The following image is schematically obtained from the hair_dryer table, and the remaining two tables are the same.
I. Vocabulary of products involved
In order to be able to set a standard based on the vocabulary of the product, we chose python as the tool. First, we used some NLP methods to select all noun phrases in the review, and then counted the frequency of these noun phrases, arranged in order from highest to lowest, and obtained the following image:
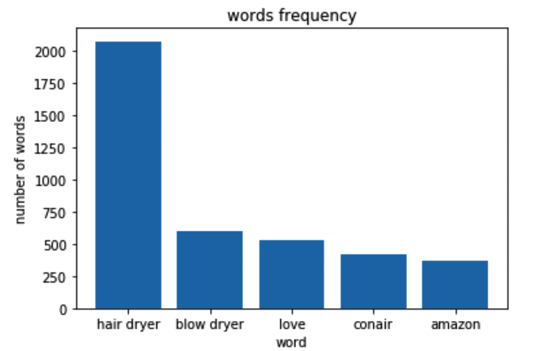
Picture-3 words frequency
Images obtained from highest to lowest word frequency (partial)
Then we selected some product-related nouns from high to low word frequency, put these nouns into a dictionary, and then traversed the reviews to get the number of vocabulary related to the product in each review, and got the following image:
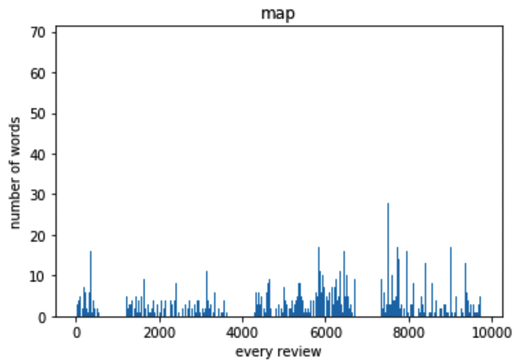
Picture-4 Vocabulary of words refers to product
By analyzing these two images, the corresponding standards can be obtained:
|
Review Quantitative Rating Method |
||||||
|
indicators/ratings |
Scoring method |
score=1 |
score=2 |
score=3 |
score=4 |
|
|
vocabulary refers to the product |
Count of product-related words appearing in reviews |
0 |
1,5 |
5,10 |
>10 |
|
Table-2 indicator of vocabulary
2.Comment length
In order to get a measure of comment length, we counted the length (number of words) of each comment and got the following distribution map:
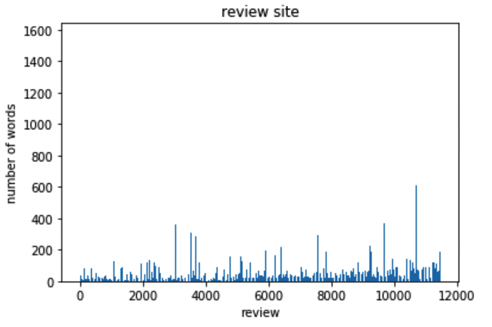
Picture-5 review length
Then we analyzed the median and average of review lengths, and got the following criteria:
|
Review Quantitative Rating Method |
||||||
|
indicators/ratings |
Scoring method |
score=1 |
score=2 |
score=3 |
score=4 |
|
|
the length of review |
Statistic comment length (measured by word length) |
<10 |
10,30 |
30,60 |
>60 |
|
Table-3 review length
3.The number of modifiers
We measure this standard by finding all adjectives and counting the number of adjectives in each comment to get the following figure:
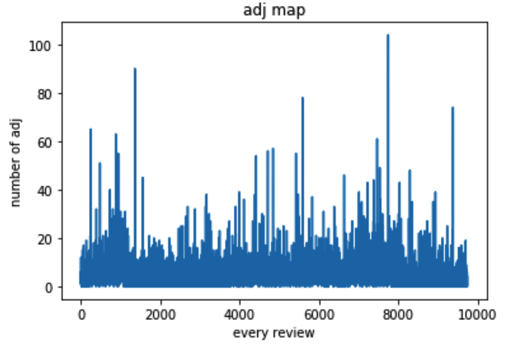
Picture-6 Number of adjectives/modifiers
The mean and median were calculated at the same time, and the following criteria were obtained:
|
Review Quantitative Rating Method |
||||||
|
indicators/ratings |
Scoring method |
score=1 |
score=2 |
score=3 |
score=4 |
|
|
Number of modifiers |
Number of modifiers |
0-2 |
3,4 |
5,10 |
>10 |
|
Table-4 number of modifiers
4.Helpful vote ratio
We get the support rate of each review by helping_votes / total (helpful_votes) of each review. The distribution image is as follows:
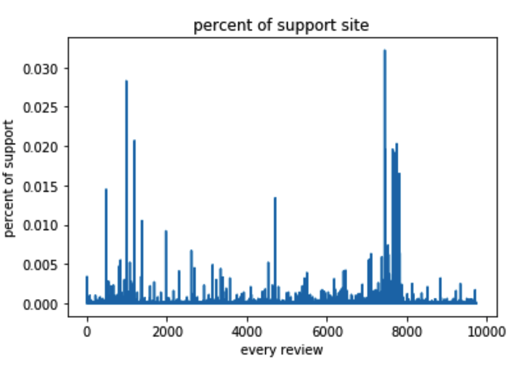
Picture-7 helpful vote ratio
After calculating the average and median, we can get the standard:
|
Review Quantitative Rating Method |
||||||
|
indicators/ratings |
Scoring method |
score=1 |
score=2 |
score=3 |
score=4 |
|
|
helpful vote ratio |
Useful votes / All helpful votes |
0-0.005 |
0.005-0.01 |
0.01-0.015 |
>0.15 |
|
Table-5 helpful vote ratio
5.The intensity of emotional expression
To quote the sentiment score of the comment above, take the absolute value of the sentiment score to get the following table:
|
Review Quantitative Rating Method |
||||||
|
indicators/ratings |
Scoring method |
score=1 |
score=2 |
score=3 |
score=4 |
|
|
Emotional expression intensity |
Counting sentiment scores in reviews |
|sentiment|=0 |
|sentiment|<0.4 |
|sentiment|<0.8 |
|sentiment|>=0.8 |
|
Table-6 The intensity of emotional expression
In this way, the final measurement standard was obtained as follows.
|
Review Quantitative Rating Method |
||||||
|
indicators/ratings |
Scoring method |
score=1 |
score=2 |
score=3 |
score=4 |
|
|
num of vacabulary refers to the product |
Count of product-related words appearing in reviews |
0 |
1,5 |
5,10 |
>10 |
|
|
the lenghth of review |
Statistic comment length (measured by word length) |
<10 |
10,30 |
30,60 |
>60 |
|
|
Number of modifiers |
Number of modifiers |
0-2 |
3,4 |
5,10 |
>10 |
|
|
helpful vote ratio |
Useful votes / All helpful votes |
0-0.005 |
0.005-0.01 |
0.01-0.015 |
>0.15 |
|
|
Emotional expression intensity |
Counting sentiment scores in reviews |
|sentiment|=0 |
|sentiment|<0.4 |
|sentiment|<0.8 |
|sentiment|>=0.8 |
|
|
Note 1: vine adds two points to Y |
Remark 2: 1 point plus for varified purchases |
|
|
|
|
|
Table-7 Review Quantitative Rating Method
Then we code a score model by python based on this standard. Then get the Review’s Quality Score as the picture below.
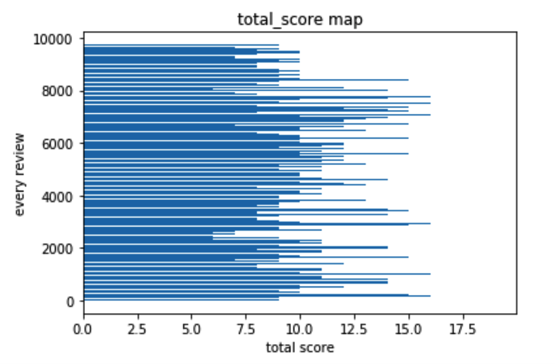
Picture-8 Reviews Quantity Score
The Relationship of Star Ratings, Reviews, and Helpfulness Ratings
In this part, we discuss the relationship with star ratings, reviews and help_rating.
First, we quantify the three indicators. For stars has been quantified as 1,2,3,4,5star, help_rating = helpful votes/total votes when total votes not equal to 0, while total vote is 0, we define Helpful Vote Ratio as 0.01.
Stars = [1,2,3,4,5]
As for reviews, we classify Review’s Sentiment Score into five levels.
Review’s Sentiment Level = [0,1,2,3,4]
|
Level |
Meaning |
|
0 |
Very negative |
|
1 |
Negative |
|
2 |
Neutral |
|
3 |
Positive |
|
4 |
Very Positive |
Table-8 Review’s sentiment level
Then we calculate the Pearson Correlation Coefficient among star_rating, help_rating and review as follows.

Table-9 Pearson Correlation Coefficient of hair dryer Table-10 Pearson Correlation Coefficient of microwave
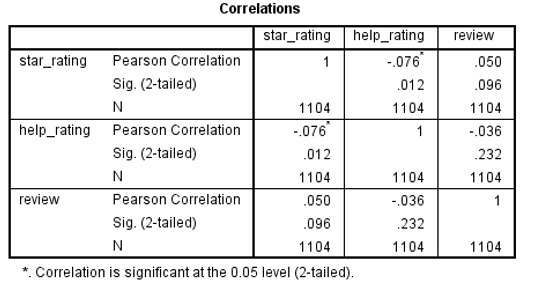
Table-11 Pearson Correlation Coefficient of pacifier
From the data in the tables above, we can conclude that no matter which product, the correlation coefficients on X and Y are close to 0, and the corresponding significance levels are 0.01, 0.05, 0.01, and the correlation is significant, indicating that there is no connection between star ratings, reviews and help_rating.
Based on the results of the discussion, we would like to further understand the comprehensive evaluation results of customers' products based on three basically irrelevant factors.
We first selected the products with the highest number of reviews from the three categories and analyzed them. They are Remington ac2015 t|studio salon collection pearl emitted hair dryer, deep purple (hair_dryer), danby 0.7 cu.ft. Countertop microwave(microwave), philips avent bpa free soothie pacifier, 0-3 months, 2 pack, packaging may vary (pacifier,the total reviews is 734) Their number of reviews is shown in the following three charts.
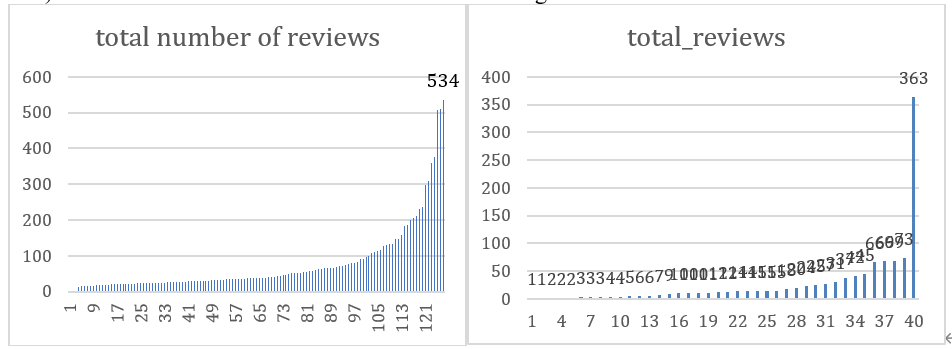
Picture-9 hair_dryers’ total number of reviews Picture-10 microwaves’ total number of reviews
According to The previous discussion, we get The values of The three factors, and we assign The weight value of each item to The score of The product based on The three factors according to AHP (The analytic hierarchy process).NOW:
1. Establish the hierarchical structure model
Take customer satisfaction as the goal and consider star_rating, help_rating, and review_score. According to their mutual relations, they are divided into the highest and the lowest levels, and a hierarchical structure diagram is drawn.
2. Construct judgment matrix
The comparison results of importance are shown in table 1. The 9 importance levels given by Saaty and their values are listed. The matrix formed by pairwise comparison is called the judgment matrix. The judgment matrix has the following properties:
The scale method of judging matrix element is as follows:
|
Factor I over factor j |
Quantitative val
ues |
|
As important |
1 |
|
A little important |
3 |
|
More important |
5 |
|
Highly important |
7 |
|
Extremely important |
9 |
|
The median of two adjacent judgments |
2,4,6,8 |
Table-12
The judgment matrix between the three is obtained:

Table-13 picture-11
From the figure, we can get that the weight value of review_score is 0.75, and the weight value of star_rating and help_rating is 0.125. The overall evaluation of the customer on the product is shown in the following formula:
Satifiaction=0.75*review_score+0.125*star_rating+0.125*help_rating
Then, we get a comprehensive score for each piece of data, which can be divided into the following three levels:
|
Score |
Satification |
|
0-1.5 |
Negative |
|
1.5-2.5 |
Neutral |
|
2.5-4 |
Positive |
Table-14
The analysis results of three products are obtained, as shown in the following three figures
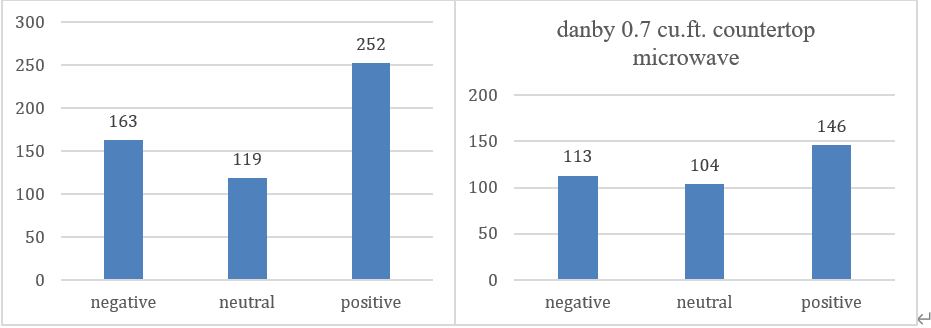
Table-15 remington ac2015 t|studio salon collection Table-16
We can see that among the 534 reviews on this product, 252 votes are positive, with a ratio of 47.2%, 163 votes are negative, and 119 votes are neutral.
We can see that among the 363 reviews on this product, 146votes are positive, with a ratio of 40.2%, 113 votes are negative, and 104 votes are neutral.
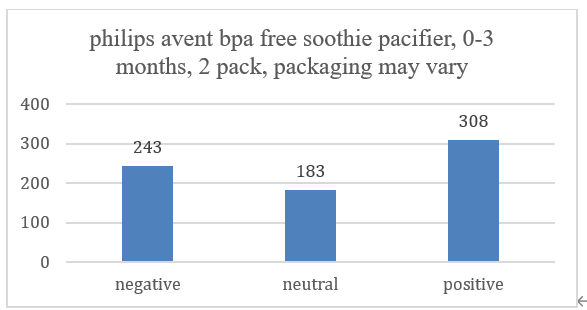
Table-17
We can see that among the 734 reviews on this product, 308 votes are positive, with a ratio of 42.0%, 243 votes are negative, and 183 votes are neutral.
Comprehensive Evaluation Model (Most Informative Ratings and Reviews)
In order to find the most informative user feedback, we use star rating, review quality score, and review sentiment score as measurement indicators through the entropy method to give weight to the three factors to get the comprehensive score of each feedback. The calculation steps are as follows:
1)Determine the Indicators
As mentioned above, they are star rating, review quality score and review sentiment score.
2) Standardize the indicators.
As the units of measurement of the indicators are not uniform, before we use them to calculate comprehensive indicators, we must standardize them, that is, convert the absolute values of the indicators into relative values to solve the problem of homogeneity of various qualitative index values. Moreover, because the positive and negative indicator values have different meanings (It is favorable that the positive indicator value is higher and the negative is lower). Therefore, we use different algorithms for data normalization for high and low indicators. The specific method is as follows:
positive indicators:

Negative indicators:
![]()
is the value of the i-th feedback’s j-th indicator (i = 1, 2…, n; j = 1, 2, …, m). For convenience, the normalized data is still recorded as
3) Calculate the proportion of the i-th feedback under the j-th indicator

4) Calculate the entropy of the j-th index:
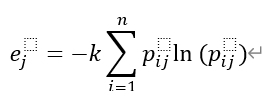
Of which satisfies
5) Calculate information entropy redundancy:
![]()
6) Calculate the weight of each indicator:

7) Calculate the overall score for each feedback:

Due to the large amount of data, we implemented the above algorithm through MATLAB, and obtained the comprehensive score of each feedback in the three data sets, which was used in subsequent analysis.
Product Reputation’s Change Over Time
As the comprehensive evaluation involves star rating, which most directly shows consumer satisfaction with the product, the quality of the evaluation, which shows the relevance of the review content and the product, the emotional score of the review, which further expresses in more details toward the product, and the comprehensive evaluation express the user's comprehensive attitude towards the product, so it can be used to represent the product reputation. Therefore, analyzing the change of product reputation over time can be transformed into analyzing the overall evaluation score of the product over time. The following table is an excerpt from our processed and calculated dataset(total_score means the Comprehensive Product Rating).
|
star_rating |
review_quality_score |
emotion_value |
total_score |
|
5 |
11 |
0.75 |
121.33 |
|
5 |
9 |
0.40 |
100.31 |
|
1 |
11 |
0.50 |
68.18 |
|
5 |
9 |
0.50 |
101.37 |
|
1 |
9 |
0.24 |
48.15 |
|
4 |
10 |
0.25 |
94.74 |
|
5 |
14 |
0.30 |
142.47 |
|
5 |
12 |
0.35 |
125.76 |
|
5 |
10 |
0.60 |
111.08 |
Table-18 Comprehensive score of each feedback
Through the data pivot table, we get the trend of the comprehensive evaluation score of the three product with each quarter, as shown in the figures below.
Baby pacifier:
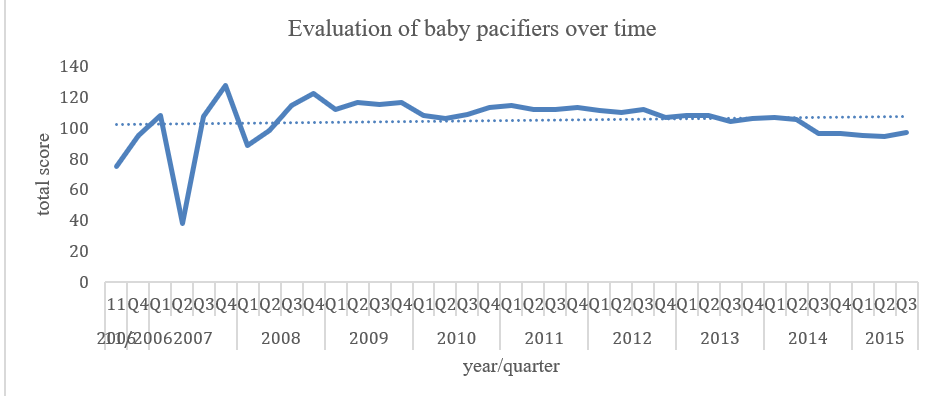
Picture-12 Evaluation of baby pacifiers over time
From the perspective of the line chart, the overall evaluation of baby pacifiers has stabilized year by year. Judging from the forecast curve (dotted line), the baby's pacifier's reputation will not change much in the future, and it may increase slightly.
Hair dryer:

Picture-13 Evaluation of hair dryer over time
We analyze the time series and use the ARIMA model,From the graph, the product evaluation fluctuated greatly from 2002 to 2006 (probably because the amount of data in recent years was not large enough) and then stabilized. Judging from the forecast curve, the reputation of hair dryers in the future may decrease slightly, and the overall stability will be stable.
Microwave:

Picture-14 Evaluation of microwave over time
From the graph, the overall evaluation of microwave ovens is on a downward trend, and the fluctuation of reputation is larger than that of the first two products. Judging from the forecast curve, the reputation of microwave ovens will decline in the future.
Product’s Future Success or Failure
In this part we discuss the future success or failure of the product from a composite score. From the analysis of the previous question, we have obtained a graph of the reputation of the product (the comprehensive score of the product) over time. Take microwave ovens as an example. The reputation of microwave ovens has decreased year by year, which means that
consumers ’satisfaction with online purchases of microwave ovens has decreased year by year. Therefore, it can be analyzed that the proportion of online purchases of microwave ovens will decrease in the future, leading to product failure.
the Relationship Between Specific Star Ratings and Reviews
We processed the 734 reviews of the pacifier product, the correlation between each review and last month's average score of star_rating, and the results are shown in the following figure:
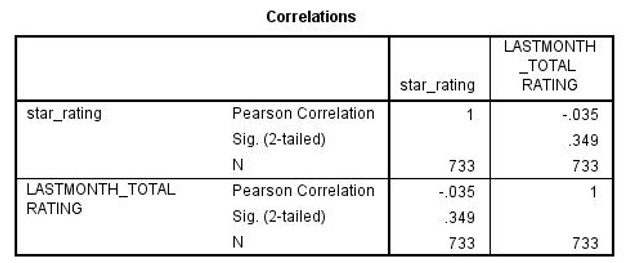
Table-19
From the data in the tables above, we can conclude that the correlation coefficients on X and Y are close to 0, and the corresponding significance levels are 0.01, The relationship between them was not significant or strong.
the Relationship Between Quality Descriptors and Rating Levels in Reviews
In the previous article, we have performed sentiment analysis on the reviews and obtained the sentiment score of each review. Here we want to explore whether the sentiment score of the review is strongly related to the star rating. To this end, we did a correlation analysis between the sentiment score and the star rating. The results are as follows:
|
star_rating |
emotion_value |
|
|
star_rating |
1 |
|
|
emotion_value |
0.359392029 |
1 |
Table-20 pacifier
|
star_rating |
emotion_value |
|
|
star_rating |
1 |
|
|
emotion_value |
0.416941057 |
1 |
Table-21 hair dryer
|
star_rating |
emotion_value |
|
|
star_rating |
1 |
|
|
emotion_value |
0.460324 |
1 |
Table-22 microwave
According to the above three correlation coefficients we find that the sentiment score of the review is positively correlated with the star rating and has a strong correlation.


