
小马哥课堂-统计学-数学期望
期望
前导
假设,盒子里面有n个球,每个球贴上了一个标签,标签上的数字是1-8;那么,从盒子中任取10个球,每次取球的过程相互独立。
1,2,3,4,5,5,7,7,7,8-总共10个数
按照如上的推算过程,直观上演示了 算术平均值 到 数学期望的 演变过程。
所以,算术平均值 和 数学期望 本是同根生。
定义
In mathematics, mean has several different definitions depending on the context.
In probability and statistics, population mean and expected value are used synonymously to refer to one measure of the central tendency either of a probability distribution or of the random variable characterized by that distribution.In the case of a discrete probability distribution of a random variable X, the mean is equal to the sum over every possible value weighted by the probability of that value; that is, it is computed by taking the product of each possible value x of X and its probability p(x), and then adding all these products together, giving \(\displaystyle \mu =\sum xp(x)\). An analogous formula applies to the case of a continuous probability distribution. Not every probability distribution has a defined mean; see the Cauchy distribution for an example. Moreover, for some distributions the mean is infinite.
For a data set, the term arithmetic mean, mathematical expectation, and sometimes average are used synonymously to refer to a central value of a discrete set of numbers: specifically, the sum of the values divided by the number of values. The arithmetic mean of a set of numbers x1, x2, ..., xn is typically denoted by \(\displaystyle {\bar {x}}\) , pronounced "x bar". If the data set were based on a series of observations obtained by sampling from a statistical population, the arithmetic mean is termed the sample mean (denoted \(\displaystyle {\bar {x}}\)) to distinguish it from the population mean (denoted $\displaystyle \mu $ or \(\displaystyle \mu _{x}\)).
在概率论和统计学中,期望的定义: 随机变量X与其概率的加权和。也即,每个随机变量x的值乘以P(x),然后再把所有的乘积项相加。是最基本的数学特征之一,是基石,是衡量随机变量分布的集中趋势,完全理解期望非常重要。
表示符号
\(\mu\)
\(\displaystyle E[X]\)
公式
对于离散型随机变量,期望的公式:\(\mu=\sum xP(x)\)
对于连续性随机变量,期望的公式:\(\mu = \int_{-{\infty}}^{\infty} xf(x)dx\)
通过python实现期望,中位数,众数
#!/usr/bin/env python3
#-*- coding:utf-8 -*-
#############################################
#File Name: mean.py
#Brief: 使用python 求mean,median,mode
#Author: frank
#Email: frank0903@aliyun.com
#Created Time:2018-08-03 22:00:53
#Blog: http://www.cnblogs.com/black-mamba
#Github: https://github.com/xiaomagejunfu0903/statistic_notes
#############################################
import numpy as np
import matplotlib.pyplot as plt
def get_mode(l):
mode = []
dict_arr = dict((a, l.count(a)) for a in l)
#print(dict_arr)
if max(dict_arr.values()) == 1:
return;#没有众数
else:
for key, val in dict_arr.items():
if val == max(dict_arr.values()):
mode.append(key)
return mode
num_begin = 1
num_end = 11
cnt = 5
#1.取1-10之前的4个随机数
sample_nums = np.random.randint(num_begin,num_end,cnt)
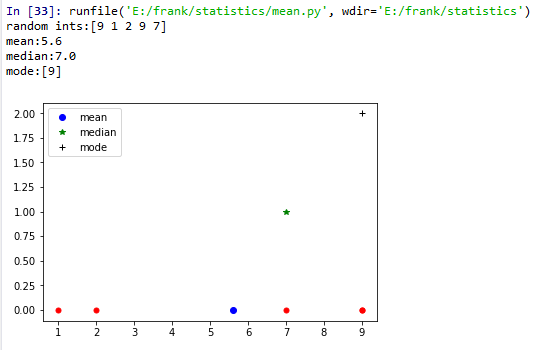
print("random ints:{}".format(sample_nums))
#求算术平均值
mean = np.mean(sample_nums)
print("mean:{}".format(mean))
#求中位数
median = np.median(sample_nums)
print("median:{}".format(median))
#求众数
mode = get_mode(sample_nums.tolist())
print("mode:{}".format(mode))
#画一组随机数的散点图
y = [0,0,0,0,0]
plt.scatter(sample_nums,y,c='r',s=25,marker='o')
mean_handle, = plt.plot(mean, 0, 'bo')
median_handle, = plt.plot(median, 1, 'g*')
mode_handle, = plt.plot(mode, 2, 'k+')
handles = (mean_handle, median_handle, mode_handle)
labels = ('mean','median','mode')
plt.legend(handles, labels)
plt.show()

 浙公网安备 33010602011771号