matplotlib之极坐标系的极径网格线(rgrids)的显示刻度
matplotlib之极坐标系的极径网格线(rgrids)的显示刻度
 1 #!/usr/bin/env python3
 2 #-*- coding:utf-8 -*-
 3 ############################
 4 #File Name: polar.py
 5 #Author: frank
 6 #Mail: frank0903@aliyun.com
 7 #Created Time:2018-05-22 22:08:01
 8 ############################
 9 import matplotlib.pyplot as plt
10 import numpy as np
11 import matplotlib as mpl
12
13 zhfont = mpl.font_manager.FontProperties(fname='/usr/share/fonts/truetype/wqy/wqy-microhei.ttc')
14
15 x = plt.subplot(111, polar=True)
16
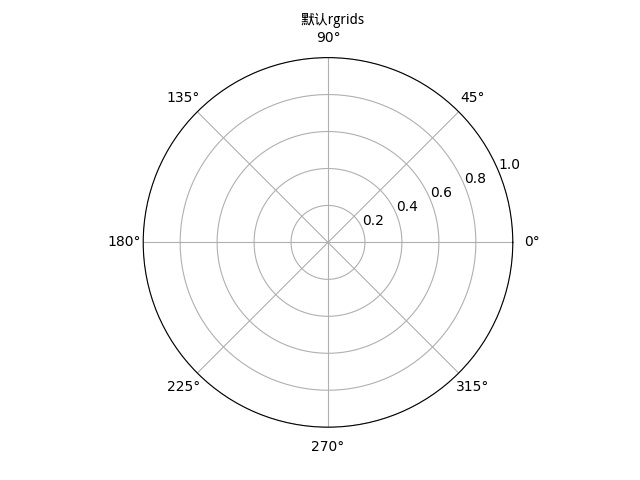
17 plt.figtext(0.52, 0.95, '默认rgrids', ha='center', size=20,fontproperties=zhfont)
18 plt.rgrids()
19 plt.savefig('default_rgrids.jpg')
20 plt.show()
21
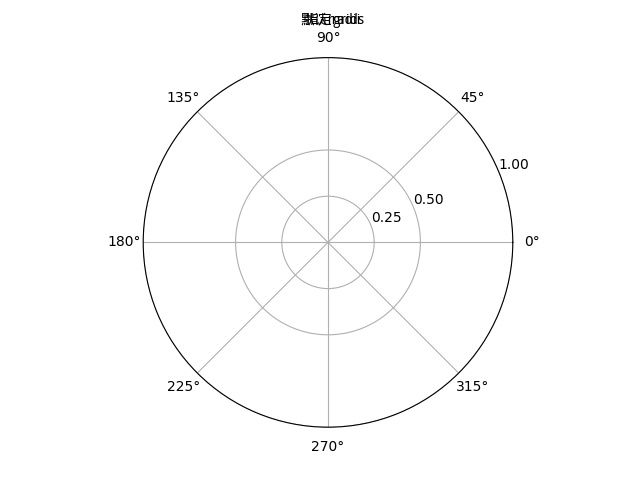
22 plt.figtext(0.52, 0.95, '指定radii', ha='center', size=20,fontproperties=zhfont)
23 plt.rgrids((0.25, 0.5, 1.0))
24 plt.savefig('specail_radii.jpg')
25 plt.show()
26
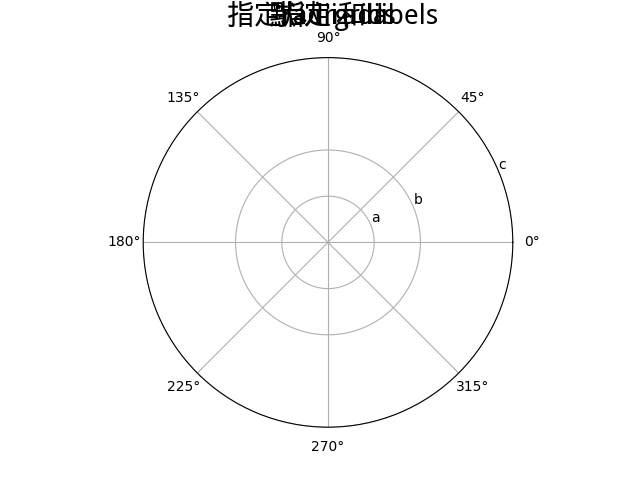
27 plt.figtext(0.52, 0.95, '指定radii和labels', ha='center', size=20,fontproperties=zhfont)
28 plt.rgrids((0.25, 0.5, 1.0), ('a', 'b', 'c'))
29 plt.savefig('specail_radii_labels.jpg')
30
31 plt.show()


matplotlib.pyplot.rgrids(*args, **kwargs)
Get or set the radial gridlines on a polar plot.
get or set 径向网格线
call signatures:
lines, labels = rgrids()
lines, labels = rgrids(radii, labels=None, angle=22.5, **kwargs)
When called with no arguments, rgrid() simply returns the tuple (lines, labels), where lines is an array of radial gridlines (Line2D instances) and labels is an array of tick labels (Text instances).
如果不带参数,那么使用默认的 极径 显示刻度
When called with arguments, the labels will appear at the specified radial distances and angles.
labels, if not None, is a len(radii) list of strings of the labels to use at each angle.
If labels is None, the rformatter will be used
如果指定 radii,那么将会以指定的 radii 显示极径刻度
如果指定radii和labels,那么极径刻度 会以指定的labels显示
angel 指定极轴偏移的角度。


