


在vue中使用dhtmlx-gantt完成甘特图
在有些项目中需要使用甘特图来标注任务进度以及时间跨度。那么如何使用dhtmlx-gantt来实现甘特图呢?
1先安装dhtmlx-gantt
yarn add dhtmlx-gantt
2引入,通过以下代码即可得到甘特图
1 2 3 4 5 6 7 8 9 10 11 12 13 14 15 16 17 18 19 20 21 22 23 24 25 26 27 28 29 30 31 32 33 34 35 36 37 38 39 40 41 42 43 44 45 46 47 48 49 50 51 52 53 54 55 56 57 58 59 60 61 62 63 64 | <template> <div style="height:600px;" ref="gantt"></div></template><script>import "dhtmlx-gantt";export default { name: "gantt", data() { return { tasks: { data: [ { id: 1, text: "Task #1", start_date: "15-04-2020", personName: "阿瓦达,林岚", duration: 5, progress: 0.6 }, { id: 2, text: "Task #2", start_date: "18-04-2020", personName: "建军节", duration: 25, progress: 0.4 }, { id: 3, text: "Task #2-1", start_date: "20-04-2020", personName: "李珊珊", duration: 3, progress: 0.4, parent: 2 }, { id: 4, text: "Task #2-1", start_date: "20-04-2020", personName: "周五", duration: 5, progress: 0.4, parent: 2 } ], links: [{ id: 1, source: 1, target: 2, type: "0" }] }, lists: [ { icon: "mdi-account", text: "个人中心", src: "/user/info" } ] }; }, mounted: function() { gantt.config.columns = [ { name: "text", label: "项目", tree: true, width: "*" }, { name: "personName", label: "负责人", align: "center" } ];--------表头数据 其中name的属性值对应展示的数据名称----------如:personName展示的就是人名,如果换成text:则展示相对应的text值。personNamegantt.config.scale_unit = "year";gantt.config.step = 1; gantt.config.date_scale = "%Y"; gantt.config.subscales = [ { unit: "day", step: 1, date: "%j" }, { unit: "month", step: 1, date: "%m" } ];当右侧不止显示年份时,可以添加展示月日,添加一个就加一行 gantt.config.scale_height = 80; 甘特图右侧表头的高度gantt.config.min_column_width = 25; //下面日期的宽度,会随时间长短宽度变化。但是设置最小宽度后,当时间跨度到达一定长度,就会展示最小宽度gantt.i18n.setLocale("cn"); //使用中文gantt.config.work_time = true; gantt.config.correct_work_time = true; 跳过节假日:比如你选择的包含周六日,他会自动延长时间或者缩短,延长或者缩短是因为包含节假日,要增加或者减少天数。gantt.config.inherit_scale_class = true; gantt.init(this.$refs.gantt); 初始化gantt.parse(this.tasks); } }; </script> <style lang='less'> @import "~dhtmlx-gantt/codebase/dhtmlxgantt.css"; 引入甘特图的css文件</style> |
效果如图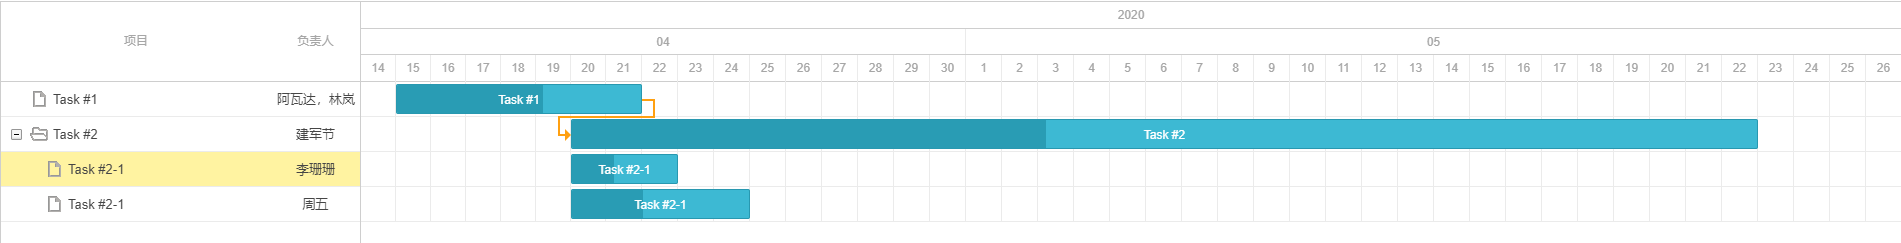


【推荐】国内首个AI IDE,深度理解中文开发场景,立即下载体验Trae
【推荐】编程新体验,更懂你的AI,立即体验豆包MarsCode编程助手
【推荐】抖音旗下AI助手豆包,你的智能百科全书,全免费不限次数
【推荐】轻量又高性能的 SSH 工具 IShell:AI 加持,快人一步
· 开发者必知的日志记录最佳实践
· SQL Server 2025 AI相关能力初探
· Linux系列:如何用 C#调用 C方法造成内存泄露
· AI与.NET技术实操系列(二):开始使用ML.NET
· 记一次.NET内存居高不下排查解决与启示
· Manus重磅发布:全球首款通用AI代理技术深度解析与实战指南
· 被坑几百块钱后,我竟然真的恢复了删除的微信聊天记录!
· 没有Manus邀请码?试试免邀请码的MGX或者开源的OpenManus吧
· 园子的第一款AI主题卫衣上架——"HELLO! HOW CAN I ASSIST YOU TODAY
· 【自荐】一款简洁、开源的在线白板工具 Drawnix