import numpy as np
import matplotlib.pyplot as plt
#创建新图片,设定图片尺寸
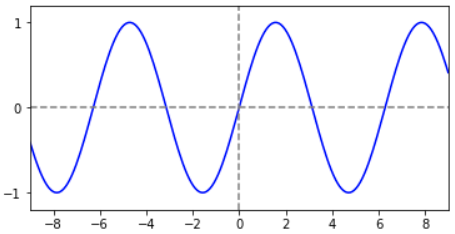
fig = plt.figure(figsize=(6,3))
x = np.linspace(-9,9,201)
y = np.sin(x)
#设置坐标轴范围
plt.xlim((-9, 9))
plt.ylim((-1.2, 1.2))
#设置坐标轴刻度
x_ticks = range(-8,9,2)
y_ticks = range(-1,2,1)
plt.xticks(x_ticks)
plt.yticks(y_ticks)
plt.plot(x,y,color='blue')
#加入参考线
plt.axhline(y=0, c="gray", ls="--", lw=1.5)
plt.axvline(x=0, c="gray", ls="--", lw=1.5)
plt.show()
import numpy as np
import matplotlib.pyplot as plt
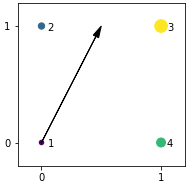
x = [0,0,1,1]
y = [0,1,0,1]
plt.figure(figsize=(3,3))
#给点打上标签
txt = [1,2,4,3]
for i in range(4):
plt.annotate(txt[i],xy=(x[i],y[i]),xytext=(x[i]+0.05,y[i]-0.035))
#画箭头
plt.arrow(0,0,0.5,1,
length_includes_head=True,
head_width=0.05,
head_length=0.1,
fc='black',
ec='black')
plt.xlim((-0.2, 1.2))
plt.ylim((-0.2, 1.2))
x_ticks = [0,1]
y_ticks = [0,1]
plt.xticks(x_ticks)
plt.yticks(y_ticks)
# 设定点的颜色和大小
plt.scatter(x,y,c=[1,2,3,4],s=[20,40,80,160])
plt.show()
import numpy as np
import matplotlib.pyplot as plt
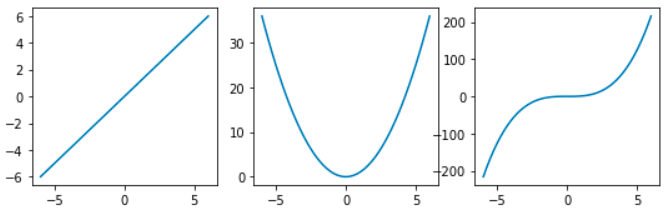
x = np.linspace(-6,6)
plt.figure(figsize=(9,2.6))
# 添加子图
plt.subplot(131)
plt.plot(x,x)
# 添加子图
plt.subplot(132)
plt.plot(x,x**2)
# 添加子图
plt.subplot(133)
plt.plot(x,x**3)
plt.show()
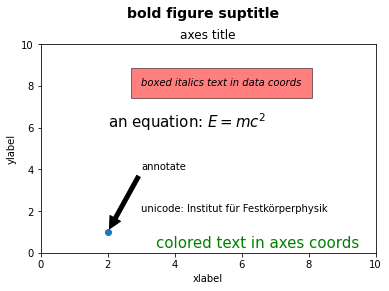
import matplotlib
import matplotlib.pyplot as plt

fig = plt.figure()
ax = fig.add_subplot()
fig.subplots_adjust(top=0.85)

# Set titles for the figure and the subplot respectively
fig.suptitle('bold figure suptitle', fontsize=14, fontweight='bold')
ax.set_title('axes title')

ax.set_xlabel('xlabel')
ax.set_ylabel('ylabel')

# Set both x- and y-axis limits to [0, 10] instead of default [0, 1]
ax.axis([0, 10, 0, 10])

ax.text(3, 8, 'boxed italics text in data coords', style='italic',
        bbox={'facecolor': 'red', 'alpha': 0.5, 'pad': 10})

ax.text(2, 6, r'an equation: $E=mc^2$', fontsize=15)

ax.text(3, 2, 'unicode: Institut für Festkörperphysik')

ax.text(0.95, 0.01, 'colored text in axes coords',
        verticalalignment='bottom', horizontalalignment='right',
        transform=ax.transAxes,
        color='green', fontsize=15)

ax.plot([2], [1], 'o')
ax.annotate('annotate', xy=(2, 1), xytext=(3, 4),
            arrowprops=dict(facecolor='black', shrink=0.05))

plt.show()