用户行为分析(Python+Tableau)项目实战
一,课题研究和背景介绍
1,课题研究:淘宝用户行为分析
2,背景介绍:
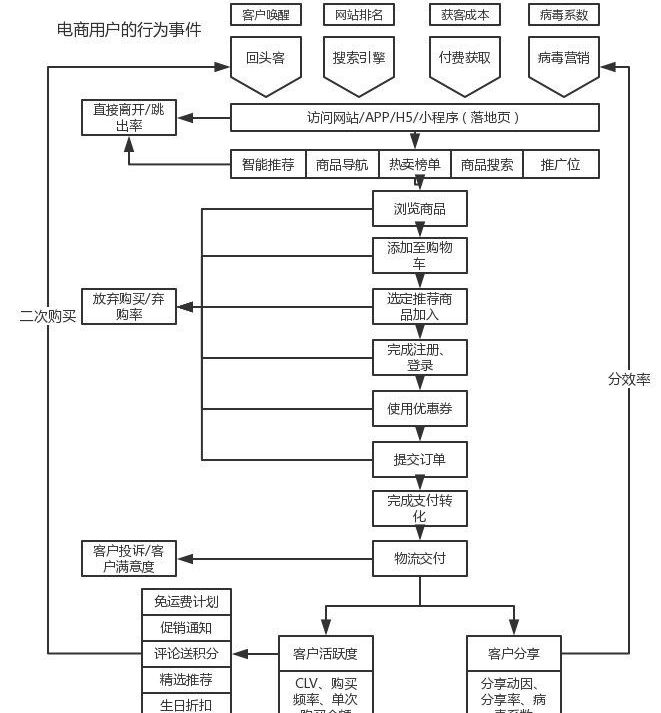
随着移动互联网的不断发展,电商行业也从以前的粗犷式发展进入到了精准的精细化时代,就淘宝而言,现在依据大数据的发展,实现了千人千面的购物,每一个人都是独立的,但是又不都是独立的,背后都有一整套完整的用户画像和营销体系,在这样的背景下,本文将基于部分的电商用户数据进行分析。下图是一张比较全面的用户在电商平台进行购物的流程图,能够和 AAARR 模型匹配起来。
二,数据
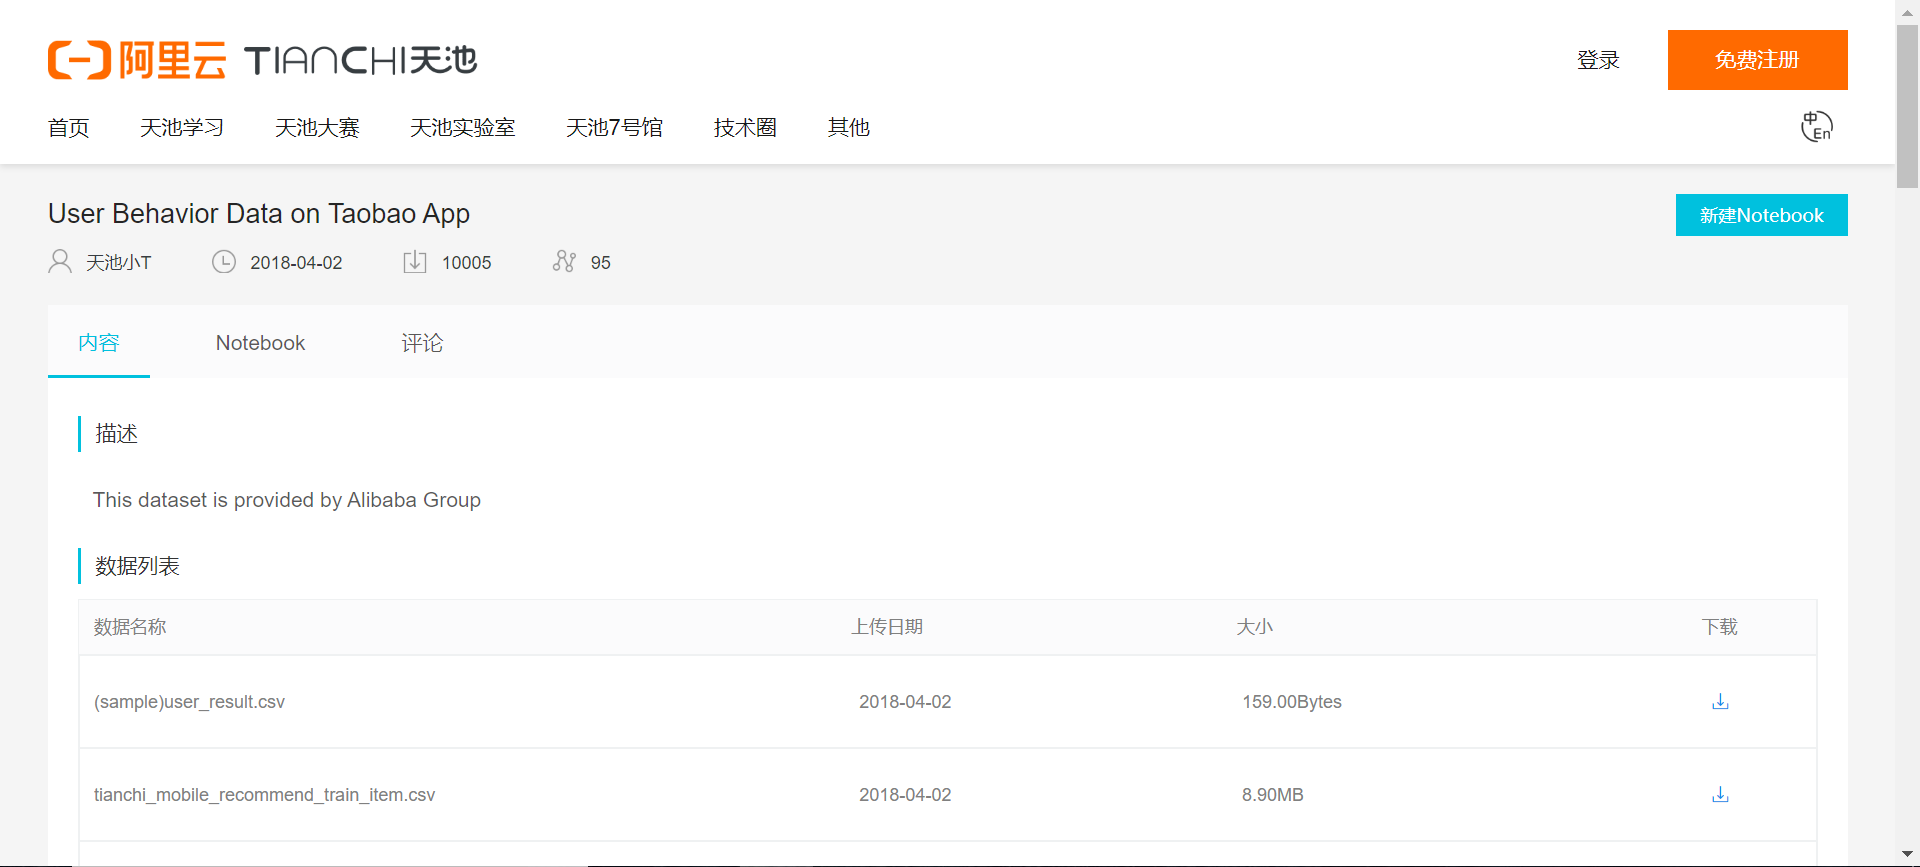
1,数据源:https://tianchi.aliyun.com/dataset/dataDetail?dataId=46
2,数据描述:
Data Description
In many cases we need to develop an individualized recommendation system for a subset of all items. When fulfilling such task, besides utilizing the user behavior data in such subset of items, we also need to utilize more comprehensive user behavior data. Notations:
U– The set of users
I– The whole set of items
P– The subset of items, P ⊆ I
D– The user behavior data set in all the set of all items.
Our objective is to develop a recommendation model for users in U on the business domain P using the data D.
The data contains two parts. The first part is the dataset D, the mobile behavior data of users in the set of all items, which is corresponding to table
数据描述
在许多情况下,我们需要为所有项目的一个子集开发个性化的推荐系统。在完成这样的任务时,除了利用这些项目子集中的用户行为数据外,我们还需要利用更全面的用户行为数据。符号:
U -用户的集合
I -整个项目集
P -项的子集,P⊆I
D -用户行为数据集在所有项目的集合中。
我们的目标是使用数据D为U中的用户开发一个关于业务域P的推荐模型。
数据包含两部分。第一部分为数据集D,即用户在所有项集合中的移动行为数据,对应于表
3,数据字段含义

tianchimobile_recommend_train_user,with the following columns
Column Description
user_id 用户的身份
item_id 用户的身份
behavior_type 用户行为类型
user_geohash 纬度(行为发生时的用户位置,可能为null)
item_category 项目的类别id
time 行为发生的时间
The table tianchi_mobile_recommend_train_item corresponds to data (P), with the following columns:
Column Description
item_id 身份的物品
item geohash 行为发生的用户位置(可能是null)
item_category 项目的类别id
三,提出问题:
1,分析目标
本次数据分析的目的是找出用户群体在整个购物过程中的转化率,找出影响用户下单的因素,并针对此提出一些改进的建议。所以本文将从流量指标,用户的转化率,用户价值模型,以及商品的销售情况去进行分析。以下是本文的大纲:
1. 从流量的角度去考虑,分析这一段时间内,用户的点击率,独立访客数,以及平均访问量。
2. 分析用户在不同的时间段的活跃规律
3. 找出最具有价值的核心用户群体,并采取相应的措施
4. 分析商品的销售情况,哪些商品最畅销,优化商品营销策略
5. 从业务流程去考虑,各流程的转化率和用户最终下单之间的影响因素
2,数据清理
①导入数据
import pandas as pd

import numpy as np

tb = pd.read_csv(r'X:\Users\orange\Desktop\sss\tianchi_mobile_recommend_train_user.csv')

tb.info()
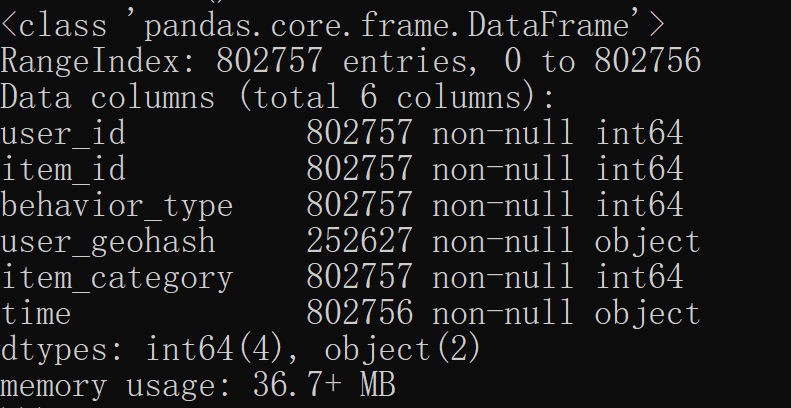
②剔除重复值
数据集中有600多万行的数据时重复的,所以我们需要将其剔除掉。最后还有600多万条的数据集。
tb.duplicated().sum() # 计算有多少重复值的值
tb.drop_duplicates(inplace=True)

③缺失值处理
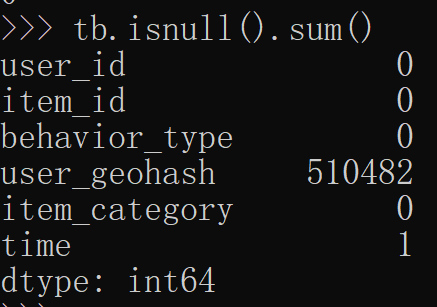
本次数据集中user_geohash存在大量的缺失值,共有833万多缺失,所以直接将该直接删掉。
tb.isnull().sum()
④数据一致化处理
首先我们需要将behavior_type由原来的1,2,3,4转换成分类的字符串,方便我们继续后续的辨认处理;其次把time 字段拆分成date和time字段,也就是日期和时间,方便我们在不同的时间维度上对用户的行为进行分析。
def behavior_type(type):
    if type == 1:
        return 'pv'
    elif type == 2:
        return 'favor'
    elif type == 3:
        return 'cart'
    else:
        return 'buy'
tb['behavior_type'] = tb['behavior_type'].apply(behavior_type)
tb['date'] = tb['time'].apply(lambda x:x.split(' ')[0])
tb['time'] = tb['time'].apply(lambda x:x.split(' ')[1])
tb.head()
最后我们把处理过的数据集保存到一个新的csv文件中。
tb.to_csv('tb_user_2014.csv',index = False)
tb.drop_duplicates('user_id').count() # 查看有多少个用户
3,分析步骤
3.1.分析用户行为的漏斗模型
①,点击,收藏,加入购物车,与购买各有多少数量
tb_behavior_type = tb['behavior_type'].value_counts().reset_index()
(tb_behavior_type['favor'] + tb_behavior_type['cart'])/tb_behavior_type['pv']
tb_behavior_type['buy']/tb_behavior_type['pv']
tb_behavior_type

②查看用户从收藏或者计入购物车到下单的转化率:
用已下单的除于加入购物车或者收藏的人数
tb_behavior_type['buy']/(tb_behavior_type['favor'] + tb_behavior_type['cart'])
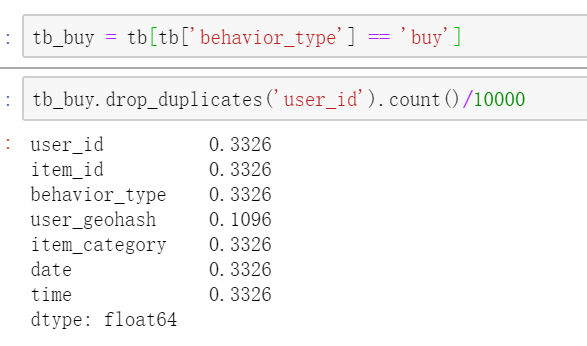
③查看付费用户数在总的用户数占比有多少呢?
tb_buy = tb[tb['behavior_type'] == 'buy']
tb_buy.drop_duplicates('user_id').count()/10000
④查看复购率
tb_two_buy = tb_buy.groupby('user_id').count()
tb_two_buy[tb_two_buy['behavior_type'] >= 2].count()

3.2不同时间段下的用户行为分析
分别以月为周期,以及以每天内的时间为单位来分析用户的行为,找出用户活跃的规律。
①用户每天的活跃规律


