调试chromium设置 How to enable logging
打印出页面元素排版: --enable-logging --log-level=0 --vmodule=cull_rect*=2
1,原始日志输出方式
日志输出需要头文件:base/logging.h
最原始的chromium日志输出是 LOG(INFO), LOG(ERROR)。这个要工作的话需要启动时加开关 --enable-logging --log-level=0
0表示就是INFO级别。
源码里面的开关
// Sets the minimum log level. Valid values are from 0 to 3:
// INFO = 0, WARNING = 1, LOG_ERROR = 2, LOG_FATAL = 3.
const char kLoggingLevel[]                  = "log-level";
2,模块可控的日志
可以按模块,即目录+文件名,这样设定;其中文件名是不包含后缀,和特殊的-inc的(比如 profile.cc.-inc, 它的模块名就是 profile)
`--vmodule` and `--v` 配合使用。v后面是非负值,默认0. 小于等于v的值,会被显示。
包含斜杠字符的模式与完整路径名匹配,而不包含斜杠字符的模式仅与基本名匹配。
匹配之前,会从每个文件名中剥离一个后缀(即最后一个 . 及其后的所有内容),以及特殊后缀 "-inl"。
*/chromeos/*=2,*chrome/browser/sync*=3
// The verbose logging can also be turned on module-by-module.  For instance,
//    --vmodule=profile=2,icon_loader=1,browser_*=3,*/chromeos/*=4 --v=0
// will cause:
//   a. VLOG(2) and lower messages to be printed from profile.{h,cc}
//   b. VLOG(1) and lower messages to be printed from icon_loader.{h,cc}
//   c. VLOG(3) and lower messages to be printed from files prefixed with
//      "browser"
//   d. VLOG(4) and lower messages to be printed from files under a
//     "chromeos" directory.
//   e. VLOG(0) and lower messages to be printed from elsewhere
//
// The wildcarding functionality shown by (c) supports both '*' (match
// 0 or more characters) and '?' (match any single character)
// wildcards.  Any pattern containing a forward or backward slash will
// be tested against the whole pathname and not just the module.
// E.g., "*/foo/bar/*=2" would change the logging level for all code
// in source files under a "foo/bar" directory.
//
// Note that for a Chromium binary built in release mode (is_debug = false) you
// must pass "--enable-logging=stderr" in order to see the output of VLOG
// statements.
设置trace跟踪
带ui的浏览器,可以在url 直接输入chrome://tracing
out\Default\chrome1.exe --enable-skia-benchmarking --enable-gpu-benchmarking --no-sandbox --process-per-site --remote-debugging-port=9222 --enable-logging --v=2 --trace-startup=cc --trace-startup-file=d:\\chrometrace.log
只在debug版本才会打印,不影响release版本 DVLOG
在Chromium中,DVLOG(20)是一种用于打印详细日志信息的宏。
这个宏的具体含义是在调试(Debug)版本中打印日志,而在发布(Release)版本中会被优化掉,因此在正式发布的软件中是不会产生这些日志的。
DVLOG是Debug Verbose Logging的缩写,它用于在调试模式下记录详细的日志信息。数字20表示日志的详细程度,具体的含义可能因上下文而异。通常,较低的数字表示更详细的日志。
// -----------------------------------------------------------------------------
// File: log/vlog_is_on.h
// -----------------------------------------------------------------------------
//
// This header defines the `VLOG_IS_ON()` macro that controls the
// variable-verbosity conditional logging.
//
// It's used by `VLOG` in log.h, or it can also be used directly like this:
//
// if (VLOG_IS_ON(2)) {
// foo_server.RecomputeStatisticsExpensive();
// LOG(INFO) << foo_server.LastStatisticsAsString();
// }
//
// Each source file has an effective verbosity level that's a non-negative
// integer computed from the `--vmodule` and `--v` flags.
// `VLOG_IS_ON(n)` is true, and `VLOG(n)` logs, if that effective verbosity
// level is greater than or equal to `n`.
//
// `--vmodule` takes a comma-delimited list of key=value pairs. Each key is a
// pattern matched against filenames, and the values give the effective severity
// level applied to matching files. '?' and '*' characters in patterns are
// interpreted as single-character and zero-or-more-character wildcards.
// Patterns including a slash character are matched against full pathnames,
// while those without are matched against basenames only. One suffix (i.e. the
// last . and everything after it) is stripped from each filename prior to
// matching, as is the special suffix "-inl".
//
// Files are matched against globs in `--vmodule` in order, and the first match
// determines the verbosity level.
//
// Files which do not match any pattern in `--vmodule` use the value of `--v` as
// their effective verbosity level. The default is 0.
//
// SetVLogLevel helper function is provided to do limited dynamic control over
// V-logging by appending to `--vmodule`. Because these go at the beginning of
// the list, they take priority over any globs previously added.
//
// Resetting --vmodule will override all previous modifications to `--vmodule`,
// including via SetVLogLevel.
实现原理:
场景:
想打印出:[2136:17392:0606/181725.815:INFO:paint_layer.cc(2758)] *layer 0000099B00101DC0 at (0,0) size 1920x1080 needsRepaint
开始以为打开开关 --enable-logging --log-level=-1 --vmodule=paint_layer*=2
后来看代码,这个打印虽然在paint_layer中,但是调用方位于cull_rect_updater.cc,并且有个条件判断 VLOG_IS_ON
void CullRectUpdater::Update() {..........#if DCHECK_IS_ON()if (VLOG_IS_ON(2)) {VLOG(2) << "PaintLayer tree after cull rect update:";ShowLayerTree(&starting_layer_); 这里才走向 paint_layer.cc}#endif}所以如果CullRectUpdater没打开,这个 VLOG_IS_ON(2)是false,所以打印不出来。
只要配置: --enable-logging --log-level=0 --vmodule=cull_rect*=2
其中 0为LOG(INFO)级别
如果启动时 vmodule为开关: --vmodule=cull_rect=2,paint_layer=2 代码跟踪流程:
\src\mojo\core\ports\node.cc
#if DCHECK_IS_ON()
    DVLOG(4) << "Sending message " << message->sequence_num()
             << " [ports=" << ports_buf.str() << "]"
             << " from " << forwarding_port_ref.name() << "@" << name_ << " to "
             << forwarding_port->peer_port_name << "@" << target_node_name;
#endif
这个DVLOG(4)会调用到:base/logging.cc
// Gets the current vlog level for the given file (usually taken from __FILE__).
template <size_t N>
int GetVlogLevel(const char (&file)[N]) {
  return GetVlogLevelHelper(file, N);
}
其中 file值为:file = 0x00007ff8481f95c0 "..\\..\\mojo\\core\\ports\\node.cc"
继续调用:N为字符串长度
int GetVlogLevelHelper(const char* file, size_t N) {
  DCHECK_GT(N, 0U);

#if BUILDFLAG(USE_RUNTIME_VLOG)
  // Note: |g_vlog_info| may change on a different thread during startup
  // (but will always be valid or nullptr).
  VlogInfo* vlog_info = GetVlogInfo();
  return vlog_info ?
      vlog_info->GetVlogLevel(base::StringPiece(file, N - 1)) :
      GetVlogVerbosity();
#else
  return GetVlogVerbosity();
#endif  // BUILDFLAG(USE_RUNTIME_VLOG)
}
走到vlog.cc
int VlogInfo::GetVlogLevel(base::StringPiece file) const {//file就是 file = {ptr_=0x00007ff88f45adde "..\\..\\third_party\\blink\\renderer\\core\\paint\\cull_rect_updater.cc" length_=...}if (!vmodule_levels_.empty()) {base::StringPiece module(GetModule(file)); //去掉路径和文件名后缀。只取文件名,叫module,即cull_rect_updaterfor (const auto& it : vmodule_levels_) { // 有两个vmodule_levels_: [0] = "cull_rect" vlog_level=2 match_target=MATCH_MODULE (0)base::StringPiece target((it.match_target == VmodulePattern::MATCH_FILE) ? file : module); 上面看到是 MATCH_MODULE,所以这里target的参数是module,即cull_rect_updater下面去看 cull_rect_updater与cull_rect 匹配不?if (MatchVlogPattern(target, it.pattern)) 其中 target是文件名,it.pattern是vmodule,如 cull_rectreturn it.vlog_level; 匹配成功返回设定的值 2}}return GetMaxVlogLevel();}
取Module的函数:StringPiece 类似现代c++的 string_view
// Given a path, returns the basename with the extension chopped off
// (and any -inl suffix). We avoid using FilePath to minimize the
// number of dependencies the logging system has.
base::StringPiece GetModule(base::StringPiece file) {
base::StringPiece module(file); 全文件路径
base::StringPiece::size_type last_slash_pos = module.find_last_of("\\/"); 找到文件名截取点
if (last_slash_pos != base::StringPiece::npos)
module.remove_prefix(last_slash_pos + 1); 截取
base::StringPiece::size_type extension_start = module.rfind('.'); 找后缀
module = module.substr(0, extension_start);
static const char kInlSuffix[] = "-inl";
static const int kInlSuffixLen = std::size(kInlSuffix) - 1;
if (base::EndsWith(module, kInlSuffix))
module.remove_suffix(kInlSuffixLen); 去掉文件结尾“-inl"
return module;
}
匹配的函数:
cull_rect_update vs cull_rect,这个返回是false。需要pattern改成 cull_rect*
bool MatchVlogPattern(base::StringPiece string,
                      base::StringPiece vlog_pattern) {
  // The code implements the glob matching using a greedy approach described in
  // https://research.swtch.com/glob.
  size_t s = 0, nexts = 0;
  size_t p = 0, nextp = 0;
  size_t slen = string.size(), plen = vlog_pattern.size();
  while (s < slen || p < plen) {
    if (p < plen) {
      switch (vlog_pattern[p]) {
        // A slash (forward or back) must match a slash (forward or back).
        case '/':
        case '\\':
          if (s < slen && (string[s] == '/' || string[s] == '\\')) {
            p++, s++;
            continue;
          }
          break;
        // A '?' matches anything.
        case '?':
          if (s < slen) {
            p++, s++;
            continue;
          }
          break;
        case '*':
          nextp = p;
          nexts = s + 1;
          p++;
          continue;
        // Anything else must match literally.
        default:
          if (s < slen && string[s] == vlog_pattern[p]) {
            p++, s++;
            continue;
          }
          break;
      }
    }
    // Mismatch - maybe restart.
    if (0 < nexts && nexts <= slen) {
      p = nextp;
      s = nexts;
      continue;
    }
    return false;
  }
  return true;
}
其他
chrome devtools面板适用说明,包括wasm c++调试
Chrome 调试技巧
vs-chromium 代码搜索
下载vs版本的代码explorer和search插件,会安装到vs2013以上版本:
http://chromium.github.io/vs-chromium/#index
下载地址:https://github.com/chromium/vs-chromium/releases/latest
启动exe文件:
cefclient.exe -url=https://www.baidu.com --enable-logging --v=1
加入断点即可。
vs-chromium-project.txt
里面写入:
[SearchableFiles.include]
*
文档:http://chromium.github.io/vs-chromium/#getting-started
How to enable logging
|
To enable logging, launch Chrome with these command line flags:
--enable-logging=stderr --v=1 # Output will be printed to standard error (eg. printed in the console) and to the debugger
--enable-logging=stderr --v=1 > log.txt 2>&1 # Capture stderr and stdout to a log file
Note that:
How do I specify the command line flags?See command line flags page.
What personal information does the log file contain?Before attaching your chrome_debug.log to a bug report, be aware that it can contain some personal information, such as URLs opened during that session of chrome.
Since the debug log is a human-readable text file, you can open it up with a text editor (notepad, vim, etc..) and review the information it contains, and erase anything you don't want the bug investigators to see.
The boilerplate values enclosed by brackets on each line are in the format:
[process_id:thread_id:ticks_in_microseconds:log_level:file_name(line_number)]
Alternatively to the above, you can use the Sawbuck utility (for Windows) to view, filter and search the logs in realtime, in a handy-dandy GUI.
 First download and install the latest version of Sawbuck, launch it, then select "Configure Providers.." form the "Log" menu.
This will bring up a dialog that looks something like this:
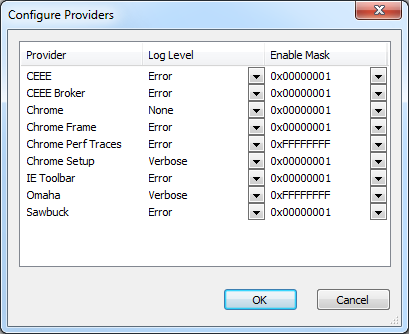 Set the log level for Chrome, Chrome Frame, and/or the Setup program to whatever suits you, and click "OK". You can revisit this dialog at any time to increase or decrease the log verbosity.
Now select "Capture" from the "Log" menu, and you should start seeing Chrome's log messages.
Note that Sawbuck has a feature that allows you to view the call trace for each log message, which can come in handy when you're trying to home in on a particular problem.
Note for 64-bit Chrome: Reporting of callstacks, source file, and line info does not currently work when originating from 64-bit Chrome, and log messages will be garbage by default (https://crbug.com/456884). Change the "Enable Mask" for the Chrome and Chrome Setup providers so that "Text Only" is the only option selected to have non-garbaled log messages.
|
Run Chromium with flags
|
There are command line flags (or "switches") that Chromium (and Chrome) accept in order to enable particular features or modify otherwise default functionality. Current switches may be found at http://peter.sh/examples/?/chromium-switches.html It is important to note that some switches are intended for temporary cases and may break in the future. Note that if you look at Windows
macOS
Linux
V8 FlagsV8 can take a number of flags as well, via Chrome's chrome.exe --js-flags="--trace-opt --trace-deopt --trace-bailout"To get a listing of all possible V8 flags: chrome.exe --js-flags="--help"Browse the V8 wiki for more flags for V8. AndroidVisit ' If you are running on a rooted device or using a debug build of Chromium, then you can set flags like so: out/Default/bin/chrome_public_apk argv # Show existing flags.You can also install, set flags, and launch with a single command: out/Default/bin/chrome_public_apk run --args='--foo --bar'For production build on a non-rooted device, you need to enable "Enable command line on non-rooted devices" in chrome://flags, then set command line in /data/local/tmp/chrome-command-line. When doing that, mind that the first command line item should be a "_" (underscore) followed by the ones you actually need. Finally, manually restart Chrome ("Relaunch" from chrome://flags page might no be enough to trigger reading this file). See https://crbug.com/784947. ContentShell on AndroidThere's an alternative method for setting flags with ContentShell that doesn't require building yourself:
adb shell am start \ -a android.intent.action.VIEW \ -n org.chromium.content_shell_apk/.ContentShellActivity \ --es activeUrl "http://chromium.org" \ --esa commandLineArgs --show-paint-rects,--show-property-changed-rectsThis will launch contentshell with the supplied flags. You can apply whatever commandLineArgs you want in that syntax. Android WebViewThis is documented in the chromium tree. Chrome OS
|

 浙公网安备 33010602011771号