YARN源码学习(七)-----Task级别GC相关指标的自定义counter添加
前言
上篇文章讲述了如何从HDFS上拿到JobHistory的Job信息数据,当然如果能对这些数据进行二次分析的话,将会得到更加精准的分析结果.但是尽管说数据是有了,但毕竟是Hadoop系统内部记录的数据,如果我想知道更加细粒度的数据,比如说,我想知道1个Task的在从运行开始到结束的过程中的gc情况,包括gc总次数,young gc,full gc次数,尤其是full gc的次数,会直观的反映task的内存使用情况,显然这么细粒度的监控指标在JobHistory上是不会存在的.因此这点可以作为我们的一个优化目标,下面的正文部分教你如何添加新的自定义Counter.
原有的Task Counter
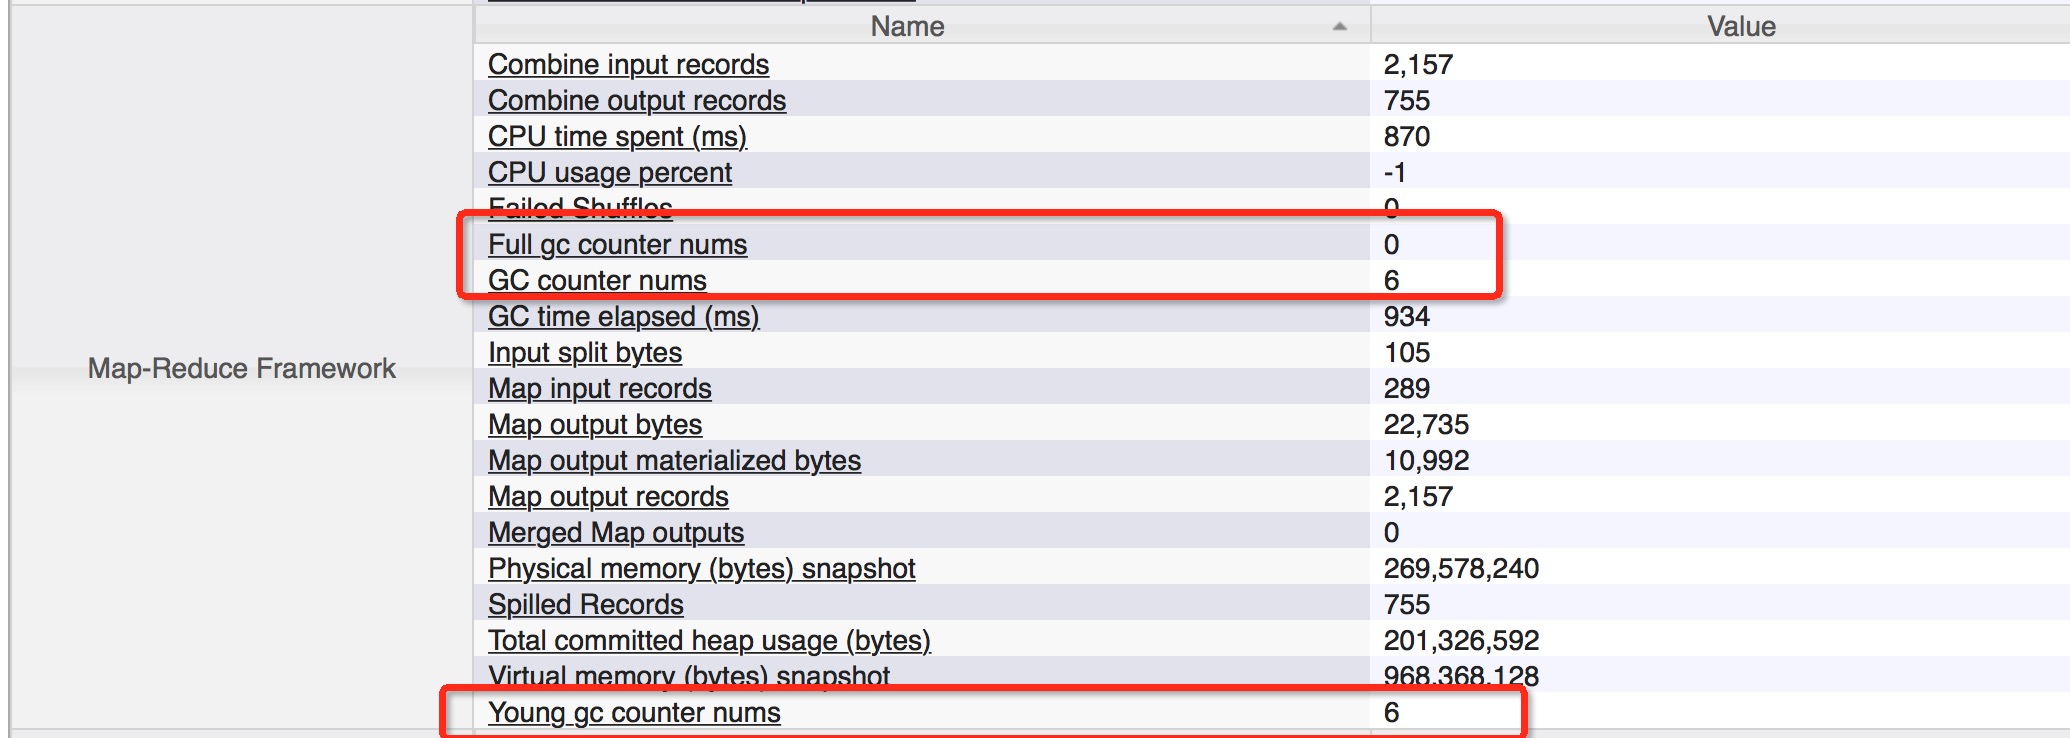
要添加新的Counter指标之前,先看看现有的JobHistory上的对于task级别的监控指标有哪些,如下图:
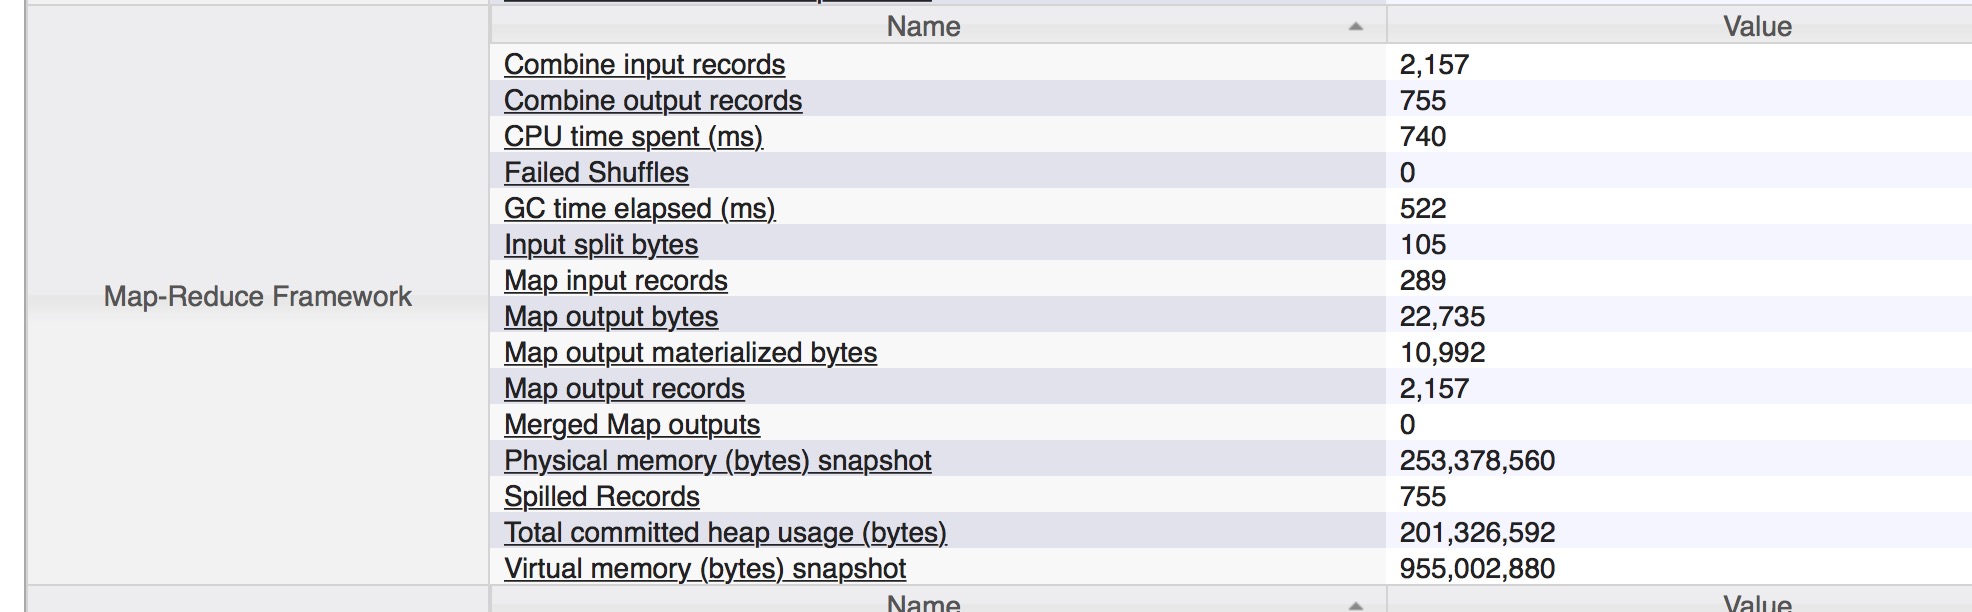
这1栏的指标是map,reduce共用1个的,因为这里所选的是一个map task,所以看到的都是map相关的指标.可以看到与gc相关的指标只有1个gc time elapsed,就是gc消耗的总时间,这个时间的计算是累加各次的gc操作所花的总时间和.我们的最终目标就是在上面能够展现除更多的gc相关的指标.
Counter结构
要想添加新的自定标Counter,需要了解一下在Yarn中Counter是如何构建的,也要了解一下他的结构原理,Counter的结构其实也没有那么简单,我这里就给大家介绍个大概,首先counter有Counter组的概念,比如在下面的页面中有3个组.
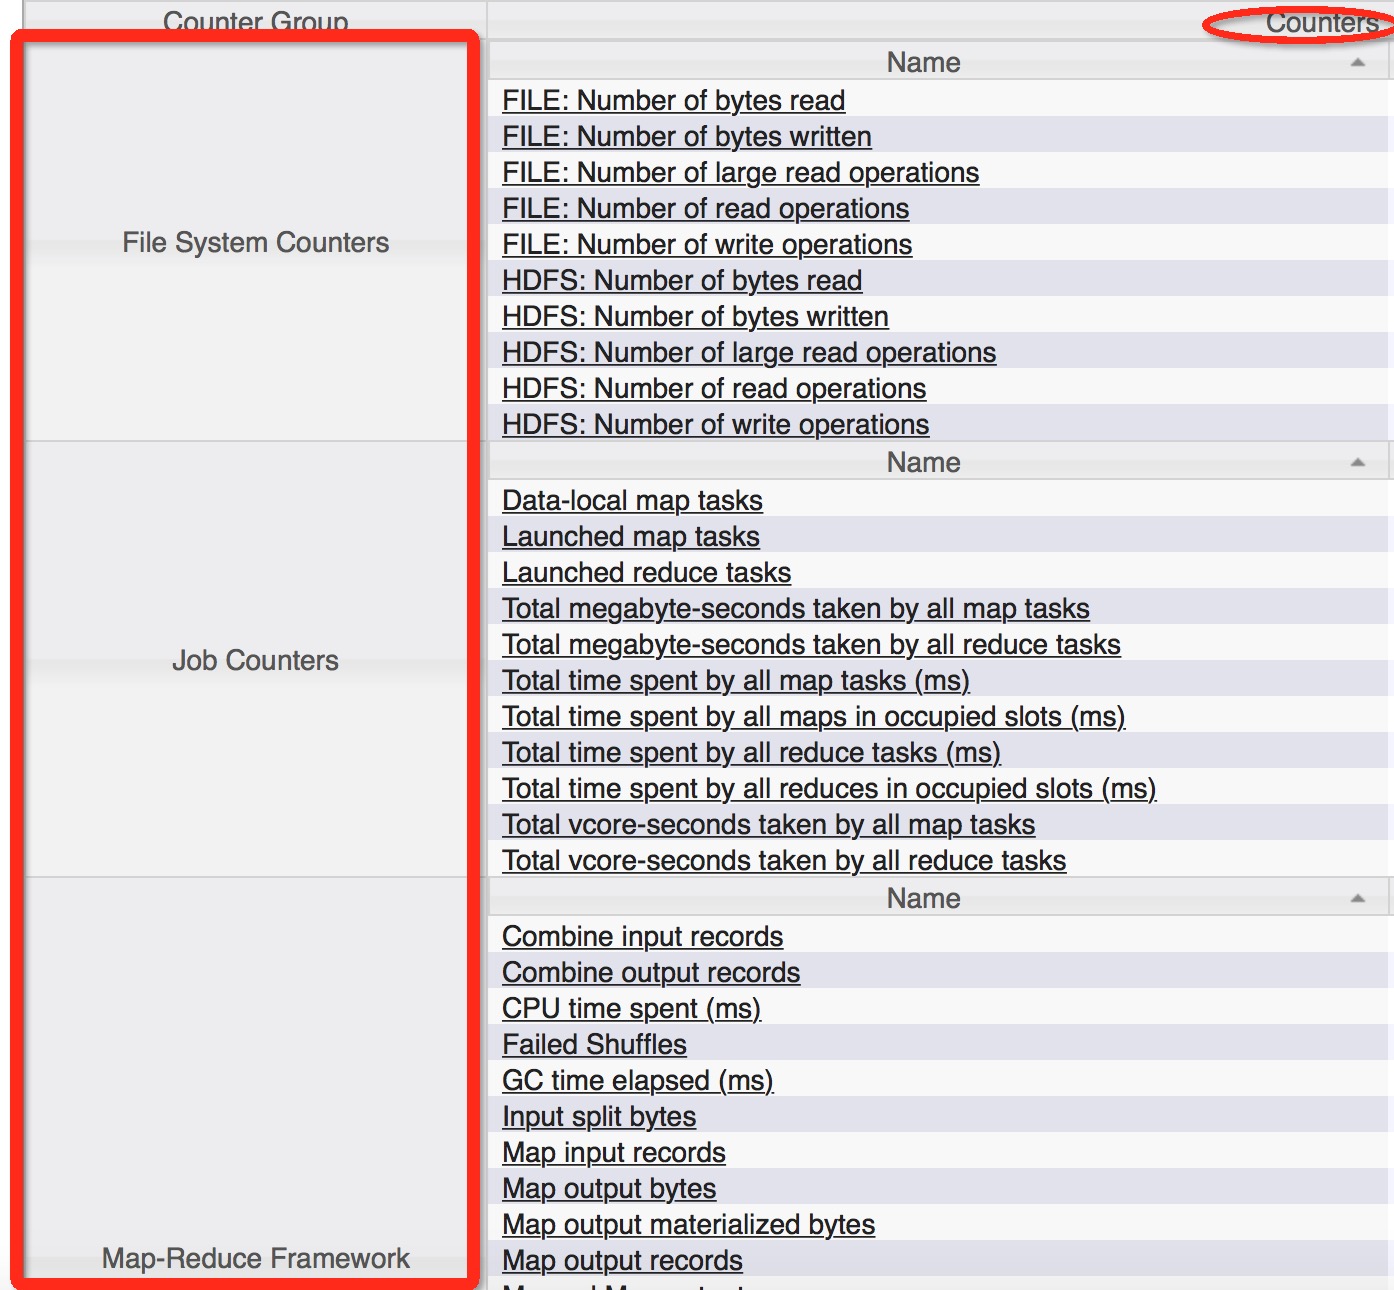
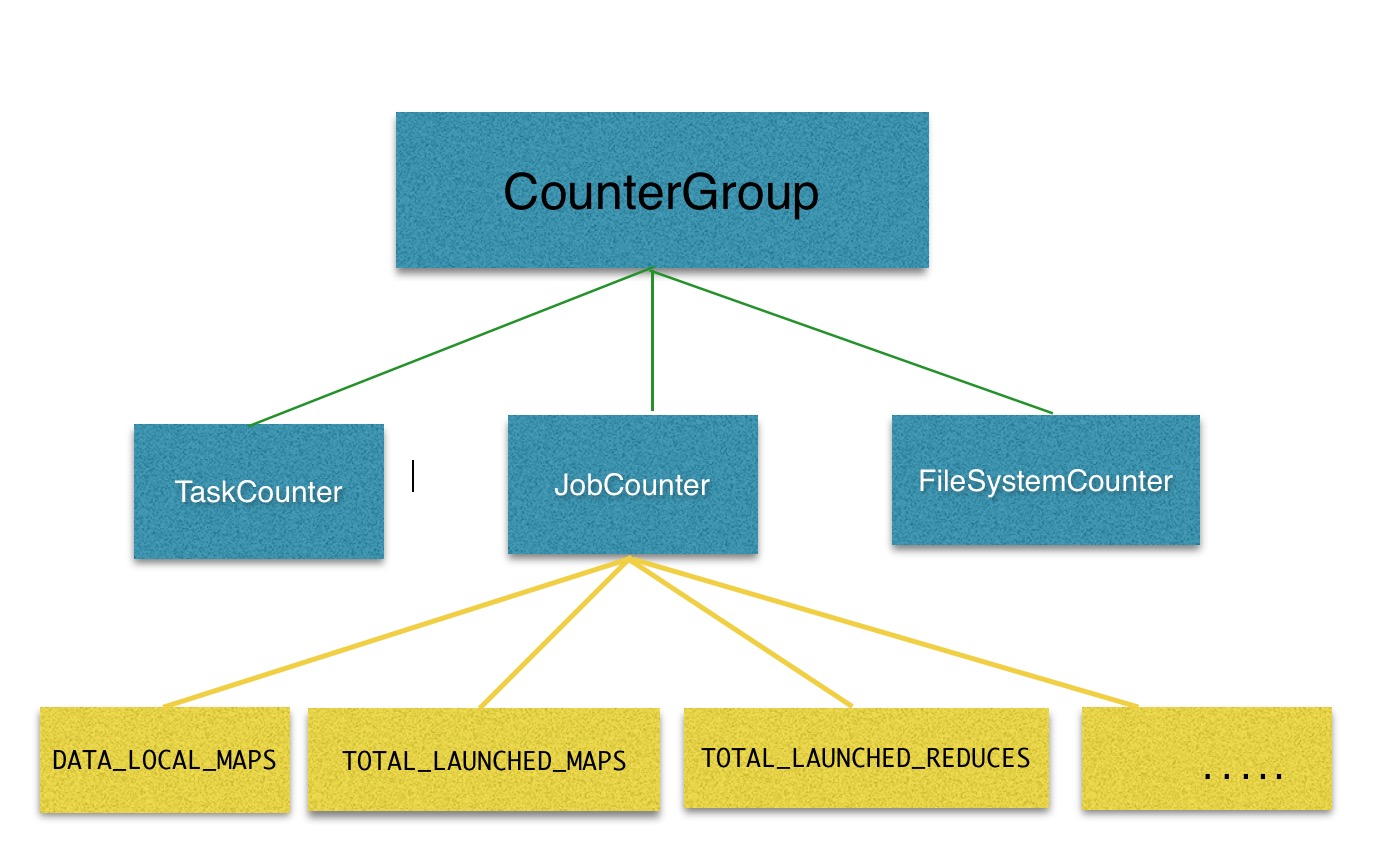
在这个页面中,展现了3个CounterGroup组的数据,在每个组内包草了许多个Counter的统计数据,用结构图展现的方式就是下面这样:
我们要加的Gc相关的Counter是属于另外1个名叫Map-Reduce FrameWork组的.
源码改造GC Counter指标
添加Gc相关的指标还是相对比较容易的,因为原本已经存在相关相似的指标存在了,我们只需要在同样的地方多加几行统计代码就OK 了.首先这个Counter是task相关的,所以定位到Task类对象中.会发现有个叫updateCounters的方法:
private synchronized void updateCounters() {
		Map<String, List<FileSystem.Statistics>> map = new HashMap<String, List<FileSystem.Statistics>>();
		for (Statistics stat : FileSystem.getAllStatistics()) {
			String uriScheme = stat.getScheme();
			if (map.containsKey(uriScheme)) {
				List<FileSystem.Statistics> list = map.get(uriScheme);
				list.add(stat);
			} else {
				List<FileSystem.Statistics> list = new ArrayList<FileSystem.Statistics>();
				list.add(stat);
				map.put(uriScheme, list);
			}
		}
		for (Map.Entry<String, List<FileSystem.Statistics>> entry : map
				.entrySet()) {
			FileSystemStatisticUpdater updater = statisticUpdaters.get(entry
					.getKey());
			if (updater == null) {// new FileSystem has been found in the cache
				updater = new FileSystemStatisticUpdater(entry.getValue(),
						entry.getKey());
				statisticUpdaters.put(entry.getKey(), updater);
			}
			updater.updateCounters();
		}

		//gc相关更新指标在这里
		gcUpdater.incrementGcCounter();
		updateResourceCounters();
}/**
* Increment the gc-elapsed-time counter.
*/
public void incrementGcCounter() {
if (null == counters) {
return; // nothing to do.
}
org.apache.hadoop.mapred.Counters.Counter gcCounter = counters
.findCounter(TaskCounter.GC_TIME_MILLIS);
if (null != gcCounter) {
gcCounter.increment(getElapsedGc());
}
}/**
* @return the number of milliseconds that the gc has used for CPU since
* the last time this method was called.
*/
protected long getElapsedGc() {
long thisGcMillis = 0;
for (GarbageCollectorMXBean gcBean : gcBeans) {
thisGcMillis += gcBean.getCollectionTime();
}
long delta = thisGcMillis - lastGcMillis;
this.lastGcMillis = thisGcMillis;
return delta;
}public GcTimeUpdater() {
this.gcBeans = ManagementFactory.getGarbageCollectorMXBeans();
getElapsedGc(); // Initialize 'lastGcMillis' with the current time
// spent.
}// Counters used by Task classes
@InterfaceAudience.Public
@InterfaceStability.Evolving
public enum TaskCounter {
...
GC_TIME_MILLIS,
GC_COUNTERS,
GC_YOUNG_COUNTERS,
GC_FULL_COUNTERS,
CPU_MILLISECONDS,
CPU_USAGE_PERCENTS,
PHYSICAL_MEMORY_BYTES,
VIRTUAL_MEMORY_BYTES,
COMMITTED_HEAP_BYTES
}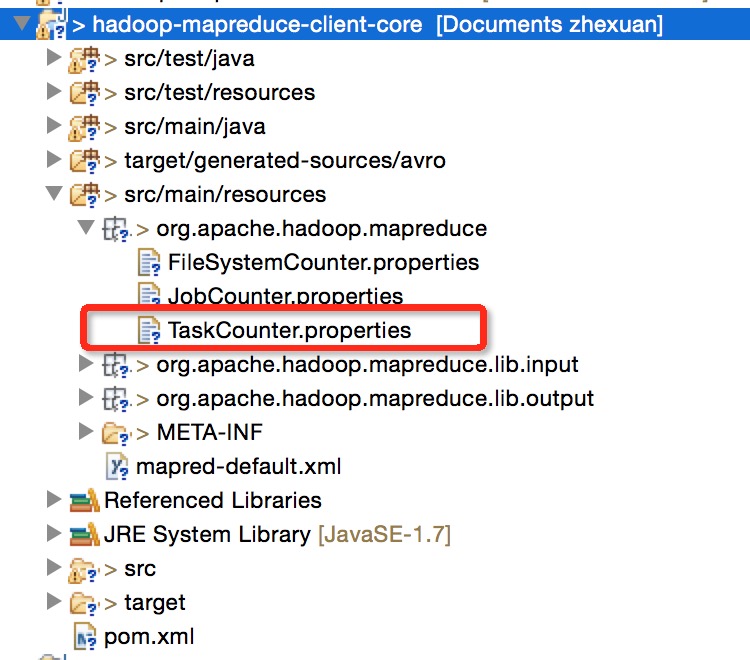
添加的新的名称定义
#   Licensed under the Apache License, Version 2.0 (the "License");
#   you may not use this file except in compliance with the License.
#   You may obtain a copy of the License at
#
#       http://www.apache.org/licenses/LICENSE-2.0
#
#   Unless required by applicable law or agreed to in writing, software
#   distributed under the License is distributed on an "AS IS" BASIS,
#   WITHOUT WARRANTIES OR CONDITIONS OF ANY KIND, either express or implied.
#   See the License for the specific language governing permissions and
#   limitations under the License.

# ResourceBundle properties file for Map-Reduce counters

CounterGroupName=              Map-Reduce Framework

.....
GC_TIME_MILLIS.name=           GC time elapsed (ms)
GC_COUNTERS.name=              GC counter nums
GC_YOUNG_COUNTERS.name=        Young gc counter nums
GC_FULL_COUNTERS.name=         Full gc counter nums
COMMITTED_HEAP_BYTES.name=     Total committed heap usage (bytes)
CPU_MILLISECONDS.name=         CPU time spent (ms)
CPU_USAGE_PERCENTS.name=       CPU usage percent
PHYSICAL_MEMORY_BYTES.name=    Physical memory (bytes) snapshot
VIRTUAL_MEMORY_BYTES.name= Virtual memory (bytes) snapshot/**
* Increment the gc-elapsed-time counter.
*/
public void incrementGcCounter() {
if (null == counters) {
return; // nothing to do.
}
org.apache.hadoop.mapred.Counters.Counter gcCounter = counters
.findCounter(TaskCounter.GC_TIME_MILLIS);
if (null != gcCounter) {
gcCounter.increment(getElapsedGc());
}
org.apache.hadoop.mapred.Counters.Counter gcCountsNum = counters
.findCounter(TaskCounter.GC_COUNTERS);
if (null != gcCountsNum) {
gcCountsNum.increment(getTotalGcNums());
}
org.apache.hadoop.mapred.Counters.Counter youngGcCountsNum = counters
.findCounter(TaskCounter.GC_YOUNG_COUNTERS);
if (null != youngGcCountsNum) {
youngGcCountsNum.increment(getYoungGcNums());
}
org.apache.hadoop.mapred.Counters.Counter fullGcCountsNum = counters
.findCounter(TaskCounter.GC_FULL_COUNTERS);
if (null != fullGcCountsNum) {
fullGcCountsNum.increment(getFullGcNums());
}
}
}protected long getTotalGcNums() {
long totalGcCounts = 0;
for (GarbageCollectorMXBean gcBean : gcBeans) {
totalGcCounts += gcBean.getCollectionCount();
}
return totalGcCounts;
}
protected long getYoungGcNums() {
long totalGcCounts = 0;
String gcCollectorName;
for (GarbageCollectorMXBean gcBean : gcBeans) {
gcCollectorName = gcBean.getName();
for (String name : youngGcCollectorNames) {
if (gcCollectorName.equals(name)) {
totalGcCounts += gcBean.getCollectionCount();
}
}
}
return totalGcCounts;
}/**
* An updater that tracks the amount of time this task has spent in GC.
*/
class GcTimeUpdater {
private String[] youngGcCollectorNames = new String[] {
// -XX:+UseSerialGC
"Copy",
// -XX:+UseParNewGC
"ParNew",
// -XX:+UseParallelGC
"PS Scavenge",
// Oracle (BEA) JRockit
// -XgcPrio:pausetime
"Garbage collection optimized for short pausetimes Young Collector",
// -XgcPrio:throughput
"Garbage collection optimized for throughput Young Collector",
// -XgcPrio:deterministic
"Garbage collection optimized for deterministic pausetimes Young Collector" };
private String[] oldGcCollectorNames = new String[] {
// -XX:+UseSerialGC
"MarkSweepCompact",
"PS MarkSweep",
// -XX:+UseConcMarkSweepGC
"ConcurrentMarkSweep",
// -XgcPrio:pausetime
"Garbage collection optimized for short pausetimes Old Collector",
// -XgcPrio:throughput
"Garbage collection optimized for throughput Old Collector",
// -XgcPrio:deterministic
"Garbage collection optimized for deterministic pausetimes Old Collector" };
...
上面的程序可能还有点bug,因为getCollectionCount得到的是一个累加的值.不是每次的递增值,读者如有兴趣可自行修改.
其他方面代码的分析请点击链接https://github.com/linyiqun/hadoop-yarn,后续将会继续更新YARN其他方面的代码分析。
参考源码
Apache-hadoop-2.7.1(hadoop-mapreduce-client-core)

 浙公网安备 33010602011771号