
grafana-alert报警(版本v9.1.3)
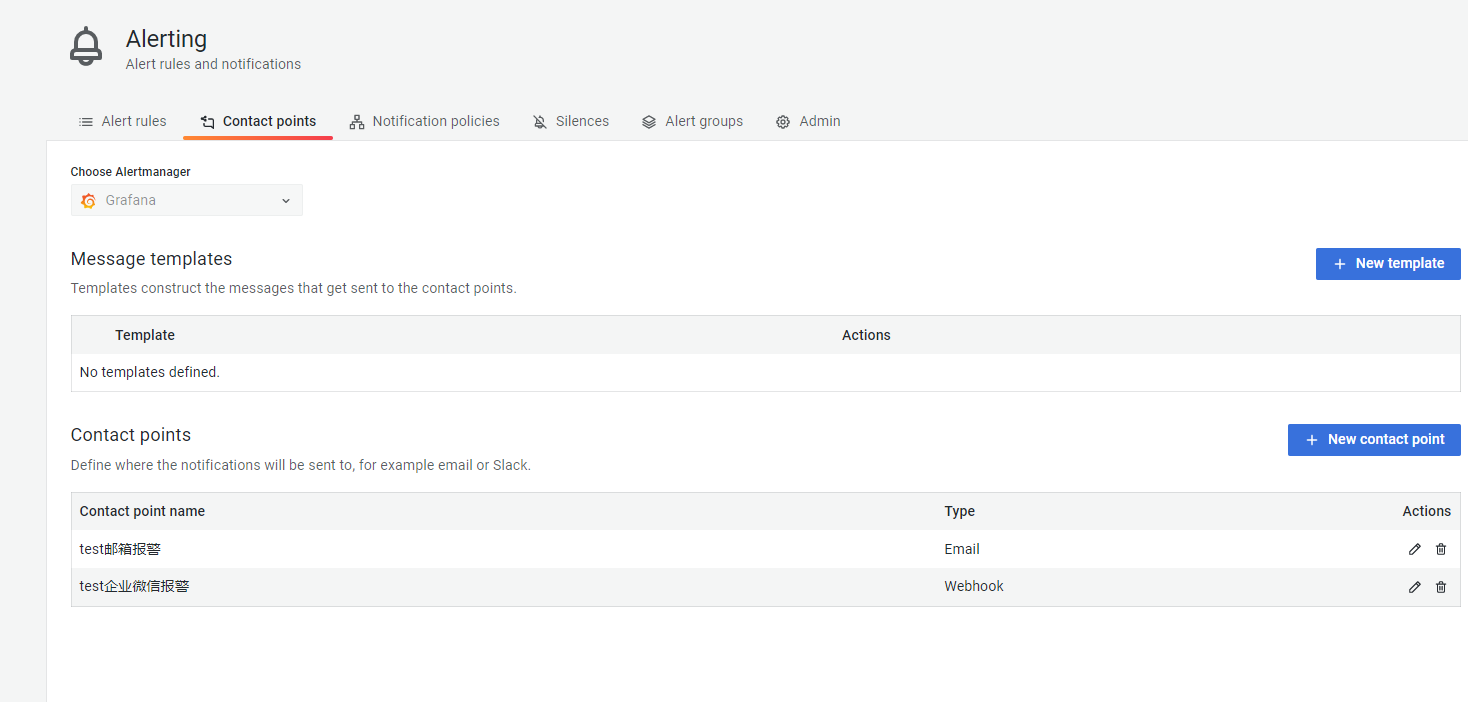
1、设置报警接入点
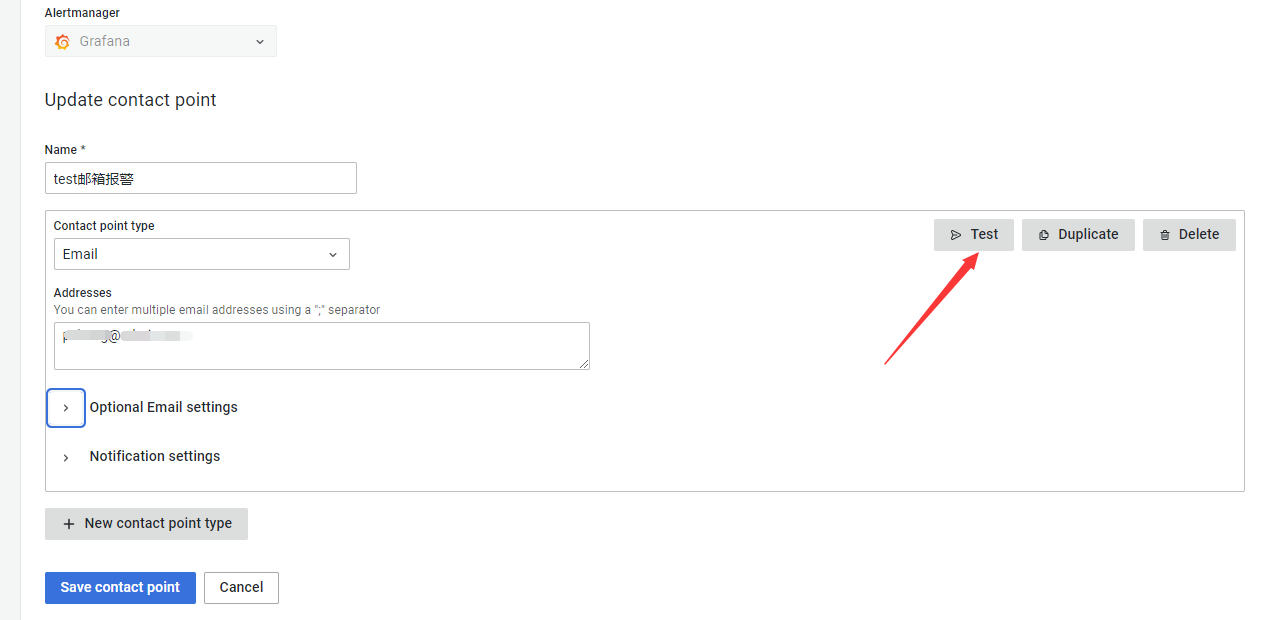
2、邮箱报警需要在 对 /etc/grafana/grafana.ini 文件进行修改
-
#################################### SMTP / Emailing ##########################
[smtp]
enabled = true
host = smtp.xxx:465
user = xx@xxx
# If the password contains # or ; you have to wrap it with triple quotes. Ex """#password;"""
password = ****
;cert_file =
;key_file =
skip_verify = true
from_address = xx@xxx
from_name = Grafana
# EHLO identity in SMTP dialog (defaults to instance_name)
;ehlo_identity = dashboard.example.com
# SMTP startTLS policy (defaults to 'OpportunisticStartTLS')
startTLS_policy = NoStartTLS

[emails]
;welcome_email_on_sign_up = false
;templates_pattern = emails/*.html, emails/*.txt
;content_types = text/html

#################################### Logging ##########################

#################################### Server ####################################
[server]
# Protocol (http, https, h2, socket)
;protocol = http

# The ip address to bind to, empty will bind to all interfaces
;http_addr =

# The http port  to use
;http_port = 3000

# The public facing domain name used to access grafana from a browser
domain = xxx.xxx.xxx.xxx   #此处为了报警中的跳转链接可访问而非localhost
sudo service grafana-server start # 启动
sudo service grafana-server status # 查看状态
sudo service grafana-server restart # 重启
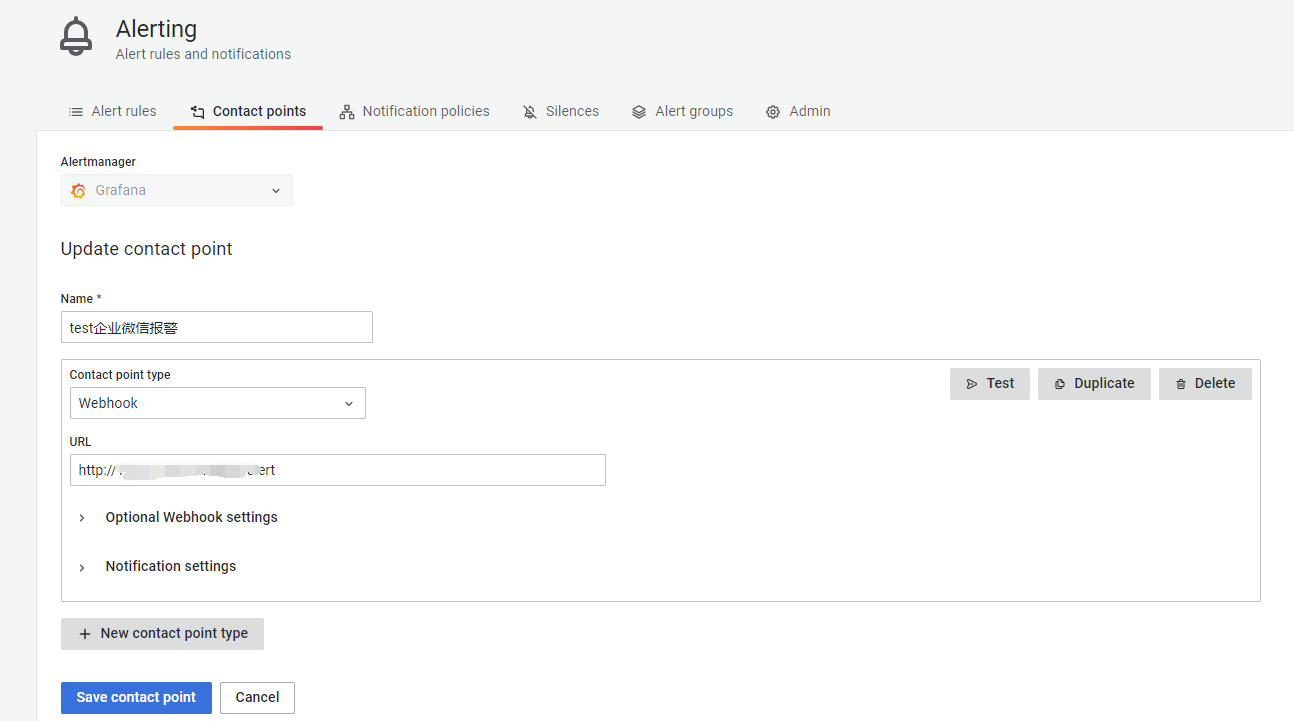
3、webhook报警,优点是可以自定义报警器地址。
4、报警内容数据, 可生成类来接收数据
{"receiver":"test企业微信报警","status":"firing","alerts":[{"status":"firing","labels":{"alertname":"jvm指标面板","grafana_folder":"测试folder","notification":"wechat"},"annotations":{"description":"jvm指标面板中展示出线程已经超过了3,注意排查"},"startsAt":"2022-11-15T15:00:00+08:00","endsAt":"0001-01-01T00:00:00Z","generatorURL":"http://xxx.xxx.xxx.xxx:3000/alerting/grafana/mT2JQevVk/view","fingerprint":"2897b4b76df45bfc","silenceURL":"http://xxx.xxx.xxx.xxx:3000/alerting/silence/new?alertmanager=grafana\u0026matcher=alertname%3Djvm%E6%8C%87%E6%A0%87%E9%9D%A2%E6%9D%BF\u0026matcher=grafana_folder%3D测试folder\u0026matcher=notification%3Dwechat","dashboardURL":"http://xxx.xxx.xxx.xxx:3000/d/_0gv9LD4z","panelURL":"http://xxx.xxx.xxx.xxx:3000/d/_0gv9LD4z?viewPanel=4","valueString":"[ var='B0' metric='sum(jvm{app=\"projectName\",biz_type=\"jvm_thread_count\",})' labels={} value=518 ]"}],"groupLabels":{},"commonLabels":{"alertname":"jvm指标面板","grafana_folder":"测试folder","notification":"wechat"},"commonAnnotations":{"description":"jvm指标面板中展示出线程已经超过了3,注意排查"},"externalURL":"http://xxx.xxx.xxx.xxx:3000/","version":"1","groupKey":"{}/{notification=\"wechat\"}:{}","truncatedAlerts":0,"orgId":1,"title":"[FIRING:1] (jvm指标面板 测试folder wechat)","state":"alerting","message":"**Firing**\n\nValue: [ var='B0' metric='sum(jvm{app=\"projectName\",biz_type=\"jvm_thread_count\",})' labels={} value=518 ]\nLabels:\n - alertname = jvm指标面板\n - grafana_folder = 测试folder\n - notification = wechat\nAnnotations:\n - description = jvm指标面板中展示出线程已经超过了3,注意排查\nSource: http://xxx.xxx.xxx.xxx:3000/alerting/grafana/mT2JQevVk/view\nSilence: http://xxx.xxx.xxx.xxx:3000/alerting/silence/new?alertmanager=grafana\u0026matcher=alertname%3Djvm%E6%8C%87%E6%A0%87%E9%9D%A2%E6%9D%BF\u0026matcher=grafana_folder%3D测试folder\u0026matcher=notification%3Dwechat\nDashboard: http://xxx.xxx.xxx.xxx:3000/d/_0gv9LD4z\nPanel: http://xxx.xxx.xxx.xxx:3000/d/_0gv9LD4z?viewPanel=4\n"}

 浙公网安备 33010602011771号