'''
Description:
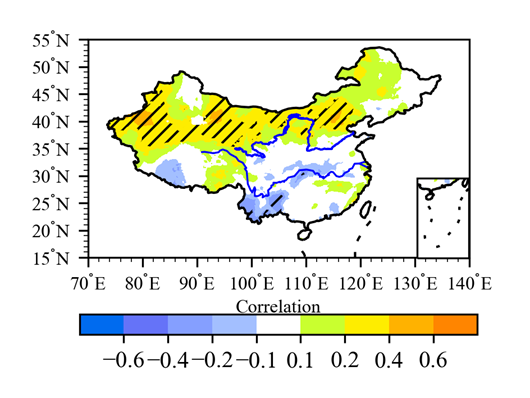
计算降水和ENSO指数的相关系数或者回归系数,并做显著性检验
-----------------------------------------
Time :2024/02/19 10:42:04
Author :Forxd
Version :1.0
'''
# %%
import xarray as xr
import numpy as np
import matplotlib.pyplot as plt
import matplotlib.pyplot as plt
from numpy import *
import pandas as pd
from scipy import stats
import geopandas as gpd
from baobao.map import select_area_data, create_rectangle
from draw_line_station import get_data
from baobao.get_cmap import get_rgb, select_cmap
from scipy.stats import pearsonr
from baobao.get_cmap import select_cmap
import cartopy.crs as ccrs # 画地图的
#%%
def get_enso_index(flnm_enso):
"""获得ENSO指数
Args:
flnm_enso (_type_): 路径
Returns:
elnino34 (xr.DataArray): [time]
Example:
flnm_enso = '../data/ElNino/nina34.data'
"""
enso = pd.read_csv(flnm_enso, sep='\s+', skiprows=1)
# enso = enso.iloc[0:-3]
enso = enso.dropna(axis=0)
time = pd.to_datetime(enso.iloc[:,0])+pd.offsets.YearEnd()
elnino34 = enso.iloc[:,1:].iloc[:,8:11].mean(axis=1)
elnino34 = xr.DataArray(
elnino34,
coords={
'time':time,
},
dims=['time']
)
return elnino34
def get_precip():
flnm = '../data/precip/data/CN05.1_Pre_1961_2021_daily_025x025.nc'
ds = xr.open_dataset(flnm)
da = ds['pre']
da = da[da.time.dt.season == 'SON']
da = da.resample(time='Y').sum()
da = xr.where(da<0.1, np.nan, da)
da = da.transpose(*(...,'lat','lon','time'))
return da
def expand_dims(x,y):
"""如果x和y中,有一个一维,一个三维,则将两个数组都扩展成三维
Args:
x (_type_): _description_
y (_type_): _description_
Returns:
_type_: _description_
"""
if len(x.shape)==3:
lat, lon, time = x.shape
elif len(y.shape)==3:
lat, lon, time = y.shape
# if
if len(x.shape)<3:
x = x[np.newaxis, np.newaxis, ...]
x = np.repeat(x, repeats=lat,axis=0)
x = np.repeat(x, repeats=lon,axis=1)
if len(y.shape)<3:
y = y[np.newaxis, np.newaxis, ...]
y = np.repeat(y, repeats=lat,axis=0)
y = np.repeat(y, repeats=lon,axis=1)
return x,y
def caculate_regression_correlation(x,y):
"""计算两个三维数组,最后一维的相关系数和线性回归系数
Args:
x (lat, lon, time): 保证最后一维为时间维
y (lat, lon, time):
Returns:
slope # 斜率
intercept # 截距
rvalue # 相关系数
pvalue # p值
Example:
y = slope*x+intercept
"""
from scipy.stats import linregress
slope = np.zeros((x.shape[0],x.shape[1])) # 斜率
intercept = np.zeros((x.shape[0],x.shape[1])) # 截距
rvalue = np.zeros((x.shape[0],x.shape[1])) # 相关系数
pvalue = np.zeros((x.shape[0],x.shape[1])) # p值
stderr = np.zeros((x.shape[0],x.shape[1])) # p值
for i in range(x.shape[0]):
for j in range(x.shape[1]):
if np.isnan(x[i,j,:]).any():
pass
slope[i,j] = np.nan
intercept[i,j] = np.nan
rvalue[i,j] = np.nan
pvalue[i,j] = np.nan
stderr[i,j] = np.nan
elif np.isnan(x[i,j,:]).any():
pass
slope[i,j] = np.nan
intercept[i,j] = np.nan
rvalue[i,j] = np.nan
pvalue[i,j] = np.nan
stderr[i,j] = np.nan
else:
# r[i,j], p[i,j] = linregress(x[i,j,:], y[i,j,:])
slope[i,j], intercept[i,j],rvalue[i,j], pvalue[i,j], stderr[i,j] = linregress(x[i,j,:],y[i,j,:])
pass
return slope, intercept, rvalue, pvalue
def create_map(fig, ax):
map_dic = {
'proj':ccrs.PlateCarree(), # 投影方式
'extent':[70, 140, 15, 55], # 绘图区域
'extent_interval_lat':5, # 纬度标签间隔
'extent_interval_lon':10, # 经度标签间隔
}
shp_path = '/home/fengx20/project/northwest_precip/data/shp/'
proj = map_dic['proj']
ax.set_extent(map_dic['extent'], crs=proj) # 设置地图范围
china0 = cfeature.ShapelyFeature(Reader(shp_path+'china0.shp').geometries(), ccrs.PlateCarree())
china11 = cfeature.ShapelyFeature(Reader(shp_path+'china11.shp').geometries(), ccrs.PlateCarree())
ax.add_feature(china0, linestyle=(0,(5,0)), linewidth=1, edgecolor='k', facecolor='None',alpha=1)
ax.add_feature(china11, linestyle=(0,(5,0)), linewidth=1, edgecolor='k', facecolor='None', alpha=1)
mf1 = shp_path+'/长江黄河/长江.shp'
mf2 = shp_path+'/river_1_5/我国一级河流.shp'
river1 = cfeature.ShapelyFeature(
Reader(mf1).geometries(),
proj,
edgecolor='k',
facecolor='none')
ax.add_feature(river1, linewidth=0.8, zorder=2, alpha=1, edgecolor='blue', facecolor='None') # zorder 设置图层为2, 总是在最上面显示
for state in Reader(mf2).records():
if state.attributes['NAME'] in ['黄河']:
# ax.add_geometries([state.geometry], edgecolor='#40A2D8', crs=ccrs.PlateCarree(), linewidth=1, facecolor='None')
ax.add_geometries([state.geometry], edgecolor='blue', crs=ccrs.PlateCarree(), linewidth=0.8, facecolor='None')
## 添加中国地图
# ax.add_feature(country, linewidth=1, zorder=2, alpha=1) # zorder 设置图层为2, 总是在最上面显示
## 设置坐标标签范围
ax.set_yticks(np.arange(15, 55+1, 5, dtype='int'), crs=proj)
ax.set_xticks(np.arange(70, 140+1, 10, dtype='int',), crs=proj)
## 设置次坐标标签间隔
ax.yaxis.set_minor_locator(ticker.MultipleLocator(1))
ax.xaxis.set_minor_locator(ticker.MultipleLocator(2))
## 设置主坐标标签格式
ax.xaxis.set_major_formatter(LongitudeFormatter(degree_symbol="$^{\circ}$")) # 使用半角的度,用latex公式给出
ax.yaxis.set_major_formatter(LatitudeFormatter(degree_symbol="$^{\circ}$"))
## 设置标签的大小和格式
ax.tick_params(axis='both', labelsize=8, direction='out')
ax.tick_params(which='major',length=4,width=0.8) # 控制标签大小
ax.tick_params(which='minor',length=2,width=0.4) #,colors='b')
return fig, ax
def get_rgb(fn):
"""
用来获取色标的, 具体参考https://zhuanlan.zhihu.com/p/521845952
色标的类型是rgb值
从txt文件中获取色标
"""
df = pd.read_csv(fn, skiprows=4, sep='\s+',encoding='gbk',header=None, names=['r','g','b'])
rgb = []
for ind, row in df.iterrows():
rgb.append(row.tolist())
rgb = np.array(rgb)/255.
return rgb
def draw_correlation_distribution(rvalue, pvalue, lon, lat):
"""绘制相关系数的填色分布, 并标注通过显著性检验的区域
Args:
rvalue (np.array): 相关系数
pvalue (np.array): p值
lon (np.array): 经度
lat (np.array): 纬度
Returns:
fig
"""
cm = 1/2.54
fig = plt.figure(figsize=(8*cm, 6*cm), dpi=300)
ax = fig.add_axes([0.15, 0.15, 0.75, 0.75], projection =ccrs.PlateCarree())
fig, ax = create_map(fig, ax, )
# colorlevel = [0, 0.1, 0.2, 0.3, 0.4, 0.5, 0.6, 0.7, 0.8]
# colorlevel = [-0.8, -0.6, -0.4, -0.2, 0.2, 0.4, 0.6, 0.8]
colorlevel = [-0.8, -0.6, -0.4, -0.2,-0.1, 0.1, 0.2, 0.4, 0.6, 0.8]
# colordict = select_cmap(flag='white_middle')
colordict = get_rgb('./9colors_whitem')
# colordict = select_cmap(flag='white_left')
# colordict = select_cmap(flag='rain9')
# x2, y2, ccc = get_pass_point(pvalue, da, sd=0.05)
crx = ax.contourf(lon, lat, rvalue,
levels=colorlevel, # 坐标的值
colors = colordict,
)
crxx = ax.contourf(lon, lat, pvalue,
levels=[0, 0.05], # 坐标的值
hatches=['////'],
colors = 'none',
add_colorbar=False,
)
ax2 = fig.add_axes([0.735, 0.352, 0.2, 0.2],projection=ccrs.PlateCarree())
fig, ax2 = create_map(fig, ax2)
extent1=[105.8, 122,0,25]
ax2.set_extent(extent1, crs=ccrs.PlateCarree())
ax2.set_xticklabels([])
ax2.set_yticklabels([])
ax2.xaxis.set_visible(False)
ax2.yaxis.set_visible(False)
crx2 = ax2.contourf(lon, # 横坐标
lat, # 纵坐标
rvalue, # 值
# corner_mask=False,
levels=colorlevel, # 坐标的值
colors = colordict,
transform=ccrs.PlateCarree()
)
colorticks = colorlevel[1:-1]
cb = fig.colorbar(
crx,
orientation='horizontal',
ticks=colorticks,
fraction = 0.08, # 色标大小,相对于原图的大小
pad=0.19, # 色标和子图间距离
# label='aaaaaa',
)
cb.ax.set_title('Correlation', y=0.41, loc='center', fontsize=8)
# cb.ax.text(y=0.1, x=0.81, s='aaa')
# ax.scatter(x2,y2,s=0.1, color='k')
return fig
def main(flnm_enso='../data/ElNino/nina34.data'):
"""计算一个ENSO指数和秋季降水的相关系数,并绘制图像
Args:
flnm_enso (str, optional): _description_. Defaults to '../data/ElNino/nina34.data'.
Returns:
_type_: _description_
"""
da = get_precip()
t = da.time
# flnm_enso = '../data/ElNino/nina34.data'
# if not flag:
elnino34 = get_enso_index(flnm_enso)
# elif flag == 'nino34_long':
# elnino34 = get_ensoindex_nino34_long(flnm_enso)
# elif flag == 'mix':
# elnino34 = get_enso_index_mix(flnm_enso)
# elif flag == 'oni':
# elnino34 = get_enso_index_oni(flnm_enso)
# elif flag == 'tni':
# elnino34 = get_enso_index_tni(flnm_enso)
## 求线性回归系数
elnino34 = elnino34.sel(time=t)
rainfall_data = da.values
enso_index = elnino34.values
enso_index, rainfall_data = expand_dims(enso_index, rainfall_data)
## 计算相关系数和截距
slope, intercept, rvalue, pvalue = caculate_regression_correlation(enso_index, rainfall_data)
## 画图
fig = draw_correlation_distribution(rvalue,pvalue, da.lon.values, da.lat.values)
return fig
#%%
if __name__ == "__main__":
pass
# %% not index file, a,b (lat, lon, time) array
enso_index, rainfall_data = expand_dims(enso_index, rainfall_data)
## 计算相关系数和截距
slope, intercept, rvalue, pvalue = caculate_regression_correlation(enso_index, rainfall_data)
fig = draw_correlation_distribution(rvalue,pvalue, da.lon.values, da.lat.values)
# %% a(lat, lon, time), index(time)
# flnm_enso = '../data/ElNino/nina34.data'
# fig = main(flnm_enso)
# fig.savefig('../figure/correlation_nina34.png')
###Created by GrADS
ncolors = 9

#  r   g   b
0 107 239
101 115 248
133 159 255
163 191 255
255 255 255
201 255 47
254 237 0
255 178 0
255 133 0


