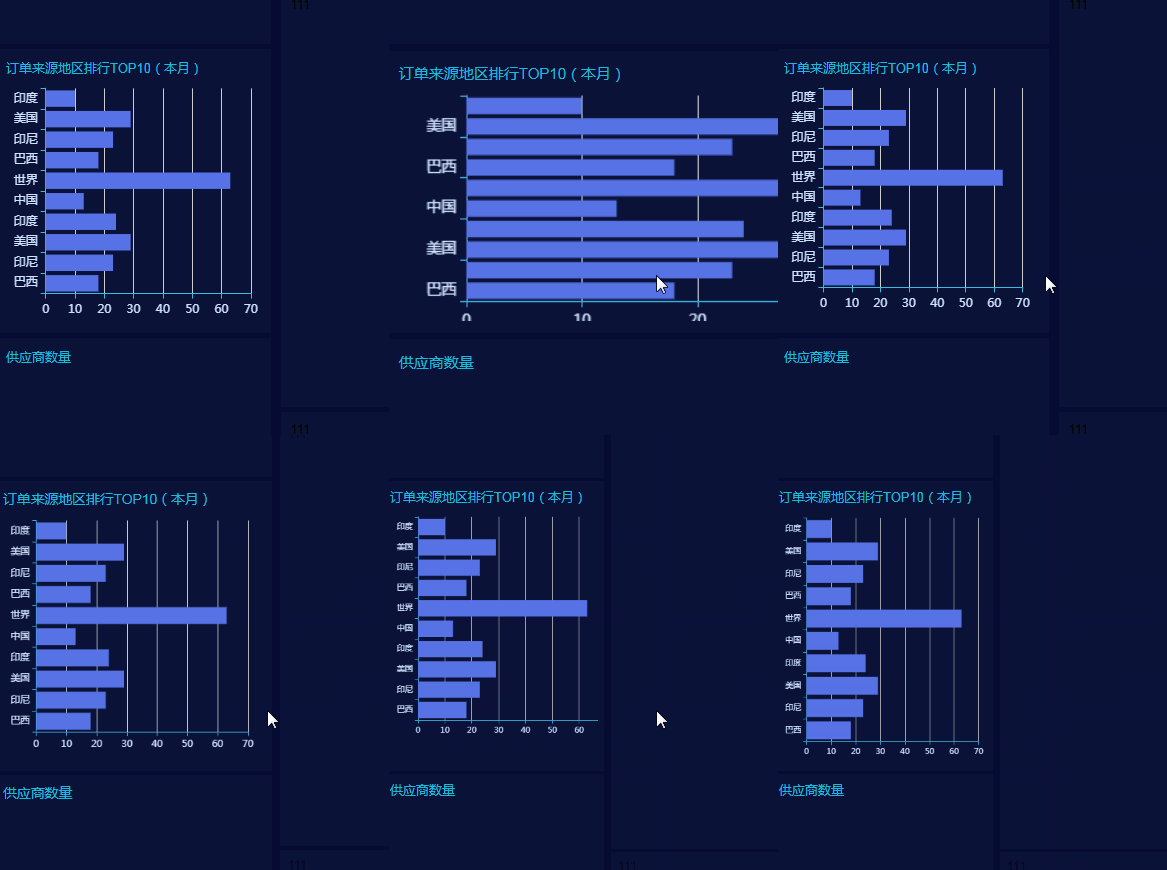
echart图表随屏幕尺寸变化的效果
效果图。 完全不懂,纯是死记。

1.安装1
cnpm install throttle-debounce --save
2.安装2
cnpm install resize-observer-polyfill --save-dev
3.js中
import { debounce } from '../../../../../../utils'
mounted() {
   this.initChart()
   this.doResizeChart()
},
methods: {
    initChart() {
        this.chart = this.$echarts.init(document.getElementById('main'))
        this.chart.setOption(this.option)
    },
    doResizeChart() {
        this.__resizeHanlder = debounce(() => {
            if (this.chart) {
                this.chart.resize()
            }
        }, 100)
        window.addEventListener('resize', this.__resizeHanlder)
    },
}
4.utils/index.js文件中
export function debounce(func, wait, immediate) {
  let timeout, args, context, timestamp, result

  const later = () => {
    // 据上一次触发时间间隔
    const last = +new Date() - timestamp

    // 上次被包装函数被调用时间间隔last小于设定时间间隔wait
    if (last < wait && last > 0) {
      timeout = setTimeout(later, wait - last)
    } else {
      timeout = null
      // 如果设定为immediate===true,因为开始边界已经调用过了此处无需调用
      if (!immediate) {
        result = func.apply(context, args)
        if (!timeout) context = args = null
      }
    }
  }

  return (...args) => {
    context = this
    timestamp = +new Date()
    const callNow = immediate && !timeout
    // 如果延时不存在,重新设定延时
    if (!timeout) timeout = setTimeout(later, wait)
    if (callNow) {
      result = func.apply(context, args)
      context = args = null
    }
    return result
  }
}


--------------------------------------------------------------------------
其实echart有一个resize()方法,直接可以缩放图标。
resize() {
  if (this.chart) {
    this.chart.resize()
  }
}


