【图像处理】使用matplotlib库显示灰度图像为自定义颜色(2)
在下面的代码中,facies_img的值只有[0,1,2]表明图像是灰度图像。通过下面的代码可以让图像显示为彩色图像
import matplotlib.pyplot as plt
import matplotlib.colors as mcolors
from PIL import Image
import os
import random
import numpy as np

# 路径设置
data_dir = 'dataset'
facies_path = os.path.join(data_dir, 'faciesData')
facies_files = os.listdir(facies_path)

# 生成一个随机数来选择文件
file_index = random.randint(1, 32640)  # 假设文件名是从1到32640
facies_img = Image.open(os.path.join(facies_path, facies_files[file_index]))
# 查找图像中所有独特的值
unique_values = np.unique(facies_img) #[0,1,2]

plt.imshow(facies_img)
plt.show()
显示的图像如下所示:

想显示自定义的颜色映射可以使用下面的代码:
import matplotlib.pyplot as plt
import matplotlib.colors as mcolors
from PIL import Image
import os
import random
import numpy as np

# 路径设置
data_dir = 'dataset'
facies_path = os.path.join(data_dir, 'faciesData')
facies_files = os.listdir(facies_path)

# 生成一个随机数来选择文件
file_index = random.randint(1, 32640)  # 假设文件名是从1到32640
facies_img = Image.open(os.path.join(facies_path, facies_files[file_index]))
# 查找图像中所有独特的值
unique_values = np.unique(facies_img) #[0,1,2]

# 定义自定义颜色映射
colors = ['white', 'red', 'yellow']  # 分别为0, 1, 2指定颜色
cmap = mcolors.ListedColormap(colors)
bounds = [-1, 0.9, 1.1, 2.1]  # 定义边界,0-1之间的值使用第一个颜色,1-2使用第二个,依此类推
norm = mcolors.BoundaryNorm(bounds, cmap.N)

plt.imshow(facies_img, cmap=cmap, norm=norm)
# plt.imshow(facies_img)
plt.show()
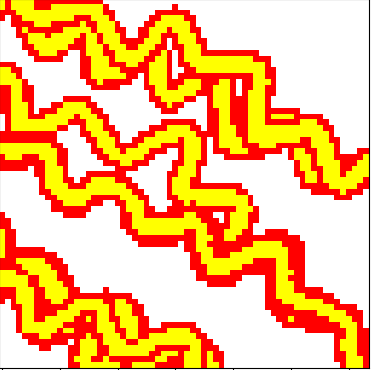
成功显示为想要的颜色

 浙公网安备 33010602011771号