梯度下降算法推导与Python实现
在求解机器学习算法的模型参数,即无约束优化问题时,梯度下降(Gradient Descent)是最常采用的方法之一,另一种常用的方法是最小二乘法。这里就对梯度下降法做一个完整的总结。
1. 梯度下降法的具体描述,请点击链接:刘建平Pinard梯度下降(Gradient Descent)小结。 他已经将梯度下降的方方面面都讲得很详细了。
2. 本文补充两点:
①梯度下降的算法(矩阵式)推演
②梯度下降算法的Python实现
2.1 梯度下降算法推演
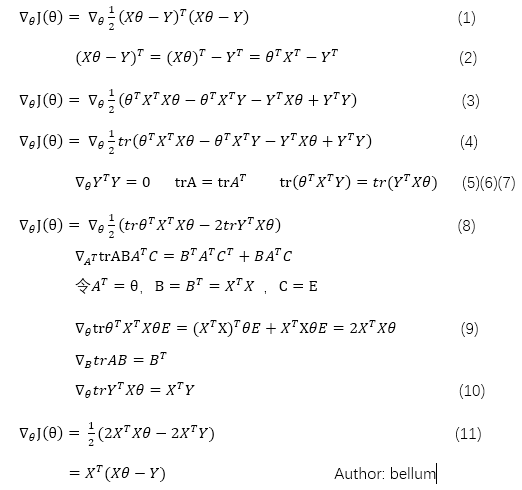
(1)式为当前位置所要求的梯度函数,(2)式将其展开生成(3)式,(4)式根据迹的特质,实数的迹等于其本身。(5)(6)(7)进行简化得到(8)式,根据公式产生式(9)(10),带入(8)式,生成(11)式,得出梯度。
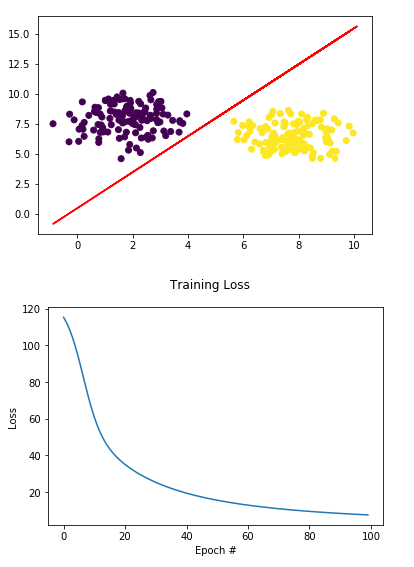
2.2 Python实现
 1 import matplotlib.pyplot as plt
 2 from sklearn.datasets.samples_generator import make_blobs
 3 import numpy as np
 4
 5 #这里用的案例是逻辑回归分类
 6 def sigmoid(x):
 7     return 1.0/(1+np.exp(-x))
 8
 9 (X, y) = make_blobs(n_samples=250, n_features=2, centers=2,
10     cluster_std=1.05, random_state=20)
11
12 #为所有的theta0,添加一个值为1的变量X0
13 X = np.c_[np.ones((X.shape[0])), X]
14
15 #初始化权重theta,这里是w
16 W = np.random.uniform(size=(X.shape[1],))
17
18 lossHistory = []
19 a = -0.01   #步长
20
21 for i in np.arange(1,100):
22     preds = sigmoid(X.dot(w))
23     error = preds - y
24     loss = np.sum(error ** 2)
25     lossHistory.append(loss)
26     print("[INFO] epoch #{}, loss={:.7f}".format(epoch + 1, loss))
27     gradient = X.T.dot(error) / X.shape[0]
28     W += a * gradient
29
30 for i in np.random.choice(250, 10):
31     activation = sigmoid_activation(X[i].dot(W))
32     label = 0 if activation < 0.5 else 1
33     print("activation={:.4f}; predicted_label={}, true_label={}".format(
34         activation, label, y[i]))
35
36 plt.figure()
37 plt.scatter(X[:, 1], X[:, 2], marker="o", c=y)
38 plt.plot(X, Y, "r-")
39
40 # construct a figure that plots the loss over time
41 fig = plt.figure()
42 plt.plot(np.arange(0, 100), lossHistory)
43 fig.suptitle("Training Loss")
44 plt.xlabel("Epoch #")
45 plt.ylabel("Loss")
46 plt.show()
最后生成图像
【参考资料】
1. 刘建平Pinard梯度下降(Gradient Descent)小结
2. 梯度下降法数学推导
3. Gradient Descent with Python
4. 简单多元线性回归

 浙公网安备 33010602011771号