


使用valgrind分析Linux程序内存泄漏
1 安装... 1
2 参数说明... 1
3 使用问题... 2
1 安装
直接使用命令行安装
sudo apt-get install valgrind
源代码下载安装
下载最新版本:http://valgrind.org/downloads/current.html#current
安装命令:
tar -jxvf valgrind-3.15.0.tar.bz2.tar.bz2
cd valgrind-3.15.0
sudo ./configure #配置
#如果更换其他安装目录,则使用如下命令
#./configure --prefix=/opt/valgrind #配置安装目录
sudo make //编译安装
sudo make install
2 参数说明
用法: valgrind [options] prog-and-args [options]:
常用选项,适用于所有Valgrind工具:
-tool= 最常用的选项。运行 valgrind中名为toolname的工具。默认memcheck。
h –help 显示帮助信息。
-version 显示valgrind内核的版本,每个工具都有各自的版本。
q –quiet 安静地运行,只打印错误信息。
v –verbose 更详细的信息, 增加错误数统计。
-trace-children=no|yes 跟踪子线程? [no]
-track-fds=no|yes 跟踪打开的文件描述符?[no]
-time-stamp=no|yes 增加时间戳到LOG信息? [no]
-log-fd= 输出LOG到描述符文件 [2=stderr]
-log-file= 将输出的信息写入到filename.PID的文件里,PID是运行程序的进行ID
-log-file-exactly= 输出LOG信息到 file
-log-file-qualifier= 取得环境变量的值来做为输出信息的文件名。 [none]
-log-socket=ipaddr:port 输出LOG到socket ,ipaddr:port
四、LOG信息输出
xml=yes 将信息以xml格式输出,只有memcheck可用
-num-callers= show callers in stack traces [12]
-error-limit=no|yes 如果太多错误,则停止显示新错误? [yes]
-error-exitcode= 如果发现错误则返回错误代码 [0=disable]
-db-attach=no|yes 当出现错误,valgrind会自动启动调试器gdb。[no]
-db-command= 启动调试器的命令行选项[gdb -nw %f %p]
适用于Memcheck工具的相关选项:
-leak-check=no|summary|full 要求对leak给出详细信息? [summary]
-leak-resolution=low|med|high how much bt merging in leak check [low]
-show-reachable=no|yes show reachable blocks in leak check? [no]
3 使用问题
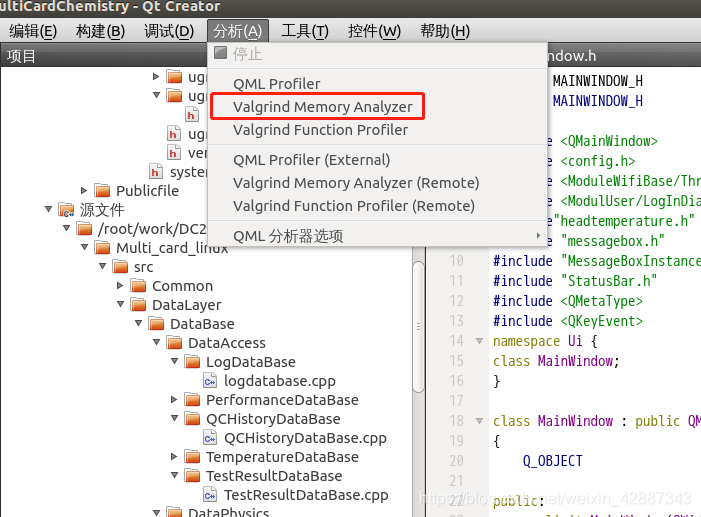
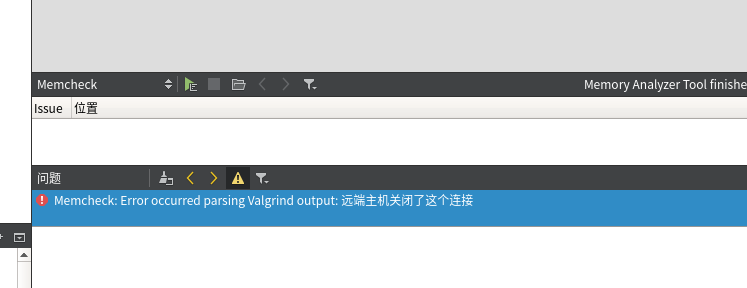
(1)安装好valgrind之后,用QtCreator去分析内存泄漏
报错:-1: error: Memcheck: Error occurred parsing Valgrind output: 远端主机关闭了这个连接
(2)打开终端用命令行执行也会报错
valgrind --leak-check=full --show-leak-kinds=all --log-file=output.txt ./testprogrom
还是会报错
==3046174== Memcheck, a memory error detector
==3046174== Copyright (C) 2002-2022, and GNU GPL'd, by Julian Seward et al.
==3046174== Using Valgrind-3.22.0 and LibVEX; rerun with -h for copyright info
==3046174== Command: ./AnalysisCenter
==3046174== Parent PID: 3044306
==3046174==
valgrind: Fatal error at startup: a function redirection
valgrind: which is mandatory for this platform-tool combination
valgrind: cannot be set up. Details of the redirection are:
valgrind:
valgrind: A must-be-redirected function
valgrind: whose name matches the pattern: strlen
valgrind: in an object with soname matching: ld-linux-x86-64.so.2
valgrind: was not found whilst processing
valgrind: symbols from the object with soname: ld-linux-x86-64.so.2
valgrind:
valgrind: Possible fixes: (1, short term): install glibc's debuginfo
valgrind: package on this machine. (2, longer term): ask the packagers
valgrind: for your Linux distribution to please in future ship a non-
valgrind: stripped ld.so (or whatever the dynamic linker .so is called)
valgrind: that exports the above-named function using the standard
valgrind: calling conventions for this platform. The package you need
valgrind: to install for fix (1) is called
valgrind:
valgrind: On Debian, Ubuntu: libc6-dbg
valgrind: On SuSE, openSuSE, Fedora, RHEL: glibc-debuginfo
valgrind:
valgrind: Note that if you are debugging a 32 bit process on a
valgrind: 64 bit system, you will need a corresponding 32 bit debuginfo
valgrind: package (e.g. libc6-dbg:i386).
valgrind:
valgrind: Cannot continue -- exiting now. Sorry.
分析说是少了libc6-dbg,需要安装libc6-dbg就可以。
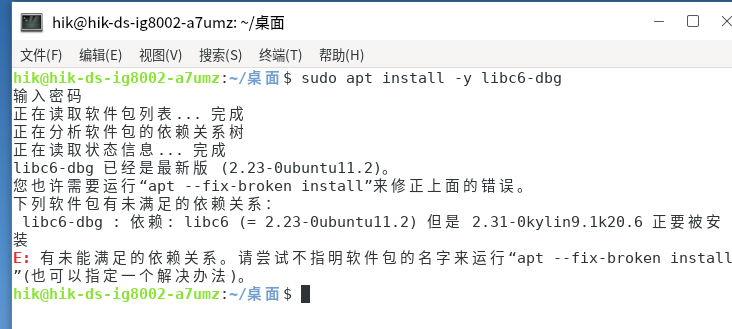
(3)使用命令安装libc6-dbg
sudo apt-get install libc6-dbg
正在读取软件包列表... 完成
正在分析软件包的依赖关系树
正在读取状态信息... 完成
libc6-dbg 已经是最新版 (2.23-0ubuntu11.2)。
您也许需要运行“apt --fix-broken install”来修正上面的错误。
下列软件包有未满足的依赖关系:
libc6-dbg : 依赖: libc6 (= 2.23-0ubuntu11.2) 但是 2.31-0kylin9.1k20.6 正要被安装
E: 有未能满足的依赖关系。请尝试不指明软件包的名字来运行“apt --fix-broken install”(也可以指定一个解决办法)。


【推荐】国内首个AI IDE,深度理解中文开发场景,立即下载体验Trae
【推荐】编程新体验,更懂你的AI,立即体验豆包MarsCode编程助手
【推荐】抖音旗下AI助手豆包,你的智能百科全书,全免费不限次数
【推荐】轻量又高性能的 SSH 工具 IShell:AI 加持,快人一步
· Manus重磅发布:全球首款通用AI代理技术深度解析与实战指南
· 被坑几百块钱后,我竟然真的恢复了删除的微信聊天记录!
· 没有Manus邀请码?试试免邀请码的MGX或者开源的OpenManus吧
· 园子的第一款AI主题卫衣上架——"HELLO! HOW CAN I ASSIST YOU TODAY
· 【自荐】一款简洁、开源的在线白板工具 Drawnix