《R语言实战》读书笔记--第三章 图形初阶(二)
3.4添加文本、自定义坐标轴和图例
很多作图函数可以设置坐标轴和文本标注。比如标题、副标题、坐标轴标签、坐标轴范围等。需要注意的是并不是所有的绘图函数都有上述的参数,需要进行验证。可以将一些默认的参数进行移除,用ann = FALSE来操作。
3.4.1标题
title函数。
title(main = NULL, sub = NULL, xlab = NULL, ylab = NULL,
      line = NA, outer = FALSE, ...)
#上面的outer是指标题是否在图形边界之外,也就是里的图形较远
#上面的…可以设置其他的参数,比如标题颜色等,这里的参数参考
#par的参数设置,需要注意的是,要将col等写成,col.main,col.lab
#cex.lab等,这些具体的函数在par参数中可以都看得到。另外,
#adj controls the justification of the titles. xpd can be used to set the clipping region: this defaults to the figure #region unless outer = TRUE, otherwise the device region and can only be increased. mgp controls the #default placing of the axis titles.
#上面这些描述还不太懂,不过par参数中也有说明。
下面是一个例子:
x <- seq(-4, 4, len = 101)
y <- cbind(sin(x), cos(x))
matplot(x, y, type = "l", xaxt = "n",
        main = expression(paste(plain(sin) * phi, "  and  ",
                                plain(cos) * phi)),
        ylab = expression("sin" * phi, "cos" * phi), # only 1st is taken
        xlab = expression(paste("Phase Angle ", phi)),
        col.main = "blue")
axis(1, at = c(-pi, -pi/2, 0, pi/2, pi),
     labels = expression(-pi, -pi/2, 0, pi/2, pi))
abline(h = 0, v = pi/2 * c(-1,1), lty = 2, lwd = .1, col = "gray70")
下面说几个语句,上面的几个expression语句是一种数学表达式的专门表达,用demo(plotmath)可以看到不少例子。expression函数可以实现将字符和特殊符号写在一起的功能。
3.4.2坐标轴
axis函数可以自定义坐标轴。
axis(side, at = NULL, labels = TRUE, tick = TRUE, line = NA,
     pos = NA, outer = FALSE, font = NA, lty = "solid",
     lwd = 1, lwd.ticks = lwd, col = NULL, col.ticks = NULL,
     hadj = NA, padj = NA, ...)
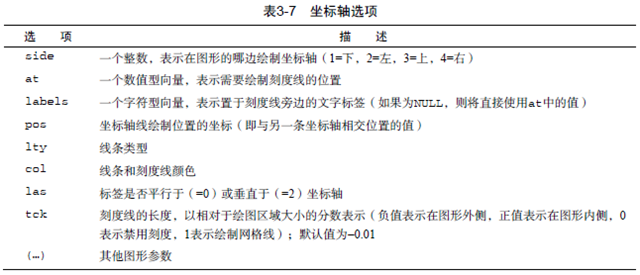
其中的参数含义下表课可见:
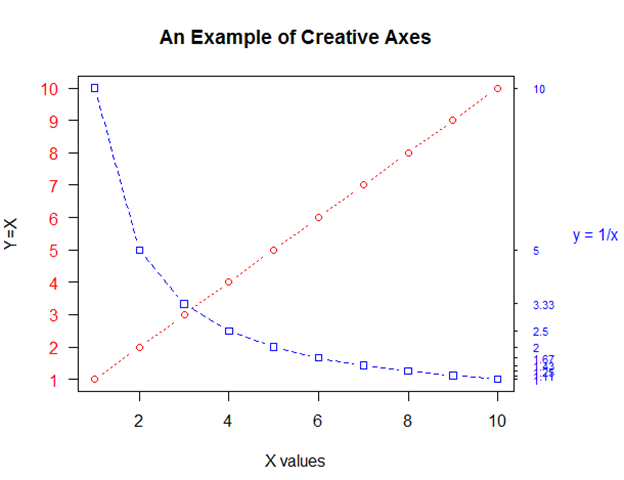
在自定义坐标州轴的情况下,应该禁用polt等函数自动生成的坐标轴。参数axes=FALSE可以禁用所有坐标轴,包括坐标轴框架等,除非添加了参数frame.plot = TRUE。参数xaxt = “n”和yaxt = “n”分别禁用x、y轴,只不过留下框架线。下面是一个例子,展示前面所述的语句和参数。
x <- c(1:10)
y <- x
z <- 10/x

opar <- par(no.readonly = TRUE)

par(mar=c(5,4,4,8) + 0.1)

plot(x,y,type = "b",
     pch = 21,col = "red",
     yaxt = "n",lty = 3,ann = FALSE)

lines(x,z,type="b",pch = 22,col = "blue",lty = 2)

axis(2,at = x,labels = x,col.axis = "red",las = 2)

axis(4,at = z,labels=round(z,digits = 2),
     col.axis = "blue",las = 2,cex.axis = 0.7,tck = -0.01)

mtext("y = 1/x",side = 4,line = 3,cex.lab = 1,las = 2,col = "blue")

title("An Example of Creative Axes",
      xlab = "X values",
      ylab = "Y=X")

par(opar)
上面的程序中的各个参数基本都ok了。注意,lines函数自动画在原来的图上。mtext函数用于在图形边界添加文本。后面会讲到。下面是图形:
次要刻度线
书上讲了一个叫次要刻度线的概念。在Hmisc包里面有minor.tick函数。后面会有例子的。
3.4.3参考线
函数abline()可以为图形添加参考线。
abline(a = NULL, b = NULL, h = NULL, v = NULL, reg = NULL,
       coef = NULL, untf = FALSE, ...)
上面a是常数项,b是斜率,h是水平线,v是竖直线。
3.4.4图例
用legend函数为图形添加图例:
legend(x, y = NULL, legend, fill = NULL, col = par("col"),
       border = "black", lty, lwd, pch,
       angle = 45, density = NULL, bty = "o", bg = par("bg"),
       box.lwd = par("lwd"), box.lty = par("lty"), box.col = par("fg"),
       pt.bg = NA, cex = 1, pt.cex = cex, pt.lwd = lwd,
       xjust = 0, yjust = 1, x.intersp = 1, y.intersp = 1,
       adj = c(0, 0.5), text.width = NULL, text.col = par("col"),
       text.font = NULL, merge = do.lines && has.pch, trace = FALSE,
       plot = TRUE, ncol = 1, horiz = FALSE, title = NULL,
       inset = 0, xpd, title.col = text.col, title.adj = 0.5,
       seg.len = 2)
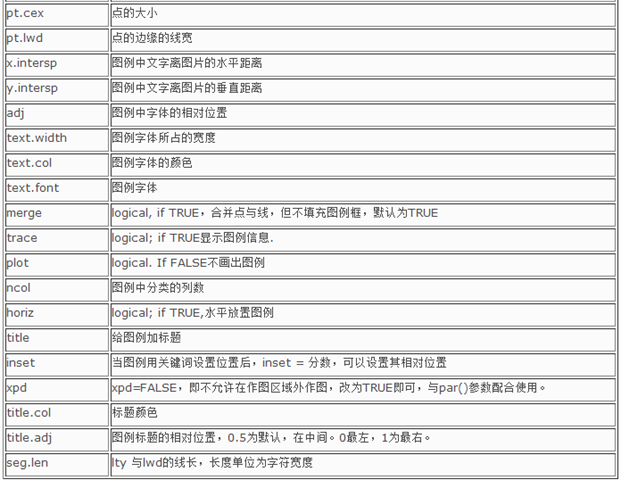
参数好多……
上面的图转自:http://blog.sina.com.cn/s/blog_5de124240101pzqb.html。
x,y是图例左上角的坐标。其他基本知道,用到的时候查表。下面是一个例子。
dose <- c(20,30,40,45,60)
drugA <- c(16,20,27,40,60)
drugB <- c(15,18,25,31,40)

opar <- par(no.readonly = TRUE)

par(lwd = 2,cex = 1.5,font.lab = 2)

plot(dose,drugA,type = "b",
     pch = 15,lty = 1,col = "red",ylim = c(0,60),
     main = "Drug A vs. Drug B",
     xlab = "Drug Dosage",ylab = "Drug Response")

lines(dose,drugB,type="b",
      pch = 17,lty = 2,col = "blue")

abline(h = c(30),lwd = 1.5,lty = 2,col = "gray")

library(Hmisc)
minor.tick(nx = 3,ny = 3,tick.ratio = 0.5)

legend("topleft",inset = .05,title = "Drug Type",c("A","B"),
       lty = c(1,2),pch = c(15,17),col = c("red","blue"),
       cex = 0.5) #最后这个参数是为了做对比图用的,用来设置图例框的相对大小

par(opar)
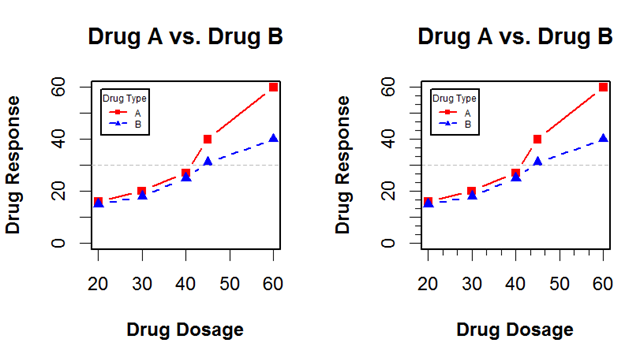
下面是结果,顺便观察了有无“次刻度线”的区别。
ok,就是将原来的刻度进行了细化。
3.4.5文本标注
用text和mtext函数向图形中添加文本。text()是为绘图区域内添加,而mtext()函数,向图形四个边界之一添加文本。分别为:
text(x, y = NULL, labels = seq_along(x), adj = NULL,#x,y是文本坐标,labels是内容,adj是[0,1]之间的
     pos = NULL, offset = 0.5, vfont = NULL,#一到两个值,是对labels的调整,vfont与Hershey vector
     cex = 1, col = NULL, font = NULL, ...)#fonts 字体组有关系

mtext(text, side = 3, line = 0, outer = FALSE, at = NA,
      adj = NA, padj = NA, cex = NA, col = NA, font = NA, ...)
下面是text()和mtext()函数的参数,
text函数除了用来标注文本之外,还可以标示图形中的点。这样的话,x和y分别就是点的横纵坐标向量,labels就是要标注文字,这三个量的长度应该是一样的。可以添加参数,family来规定输入的字体。
数字标注
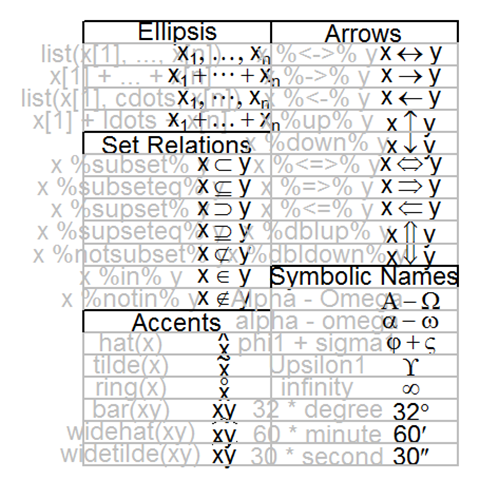
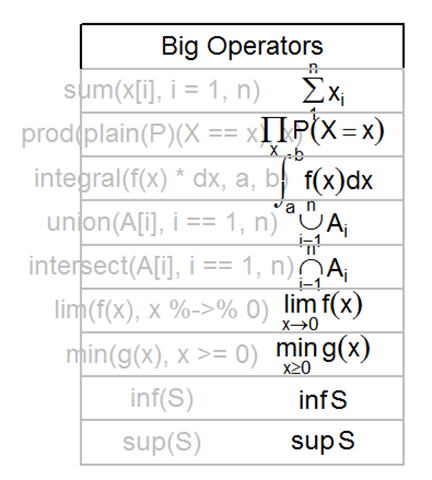
可以为图形添加数学符号和公式。可以查看help(plotmath),当然最好的方式是执行demo(plotmath)。demo中可以直接查看语句,是一些expression语句组成的,这个plotmath很强大,截两张图感受下:
几乎可以标注所有类型的数学表达。
3.5图形的组合
讨论几幅图组合成一幅图的情况,可以想像这是非常有用的。
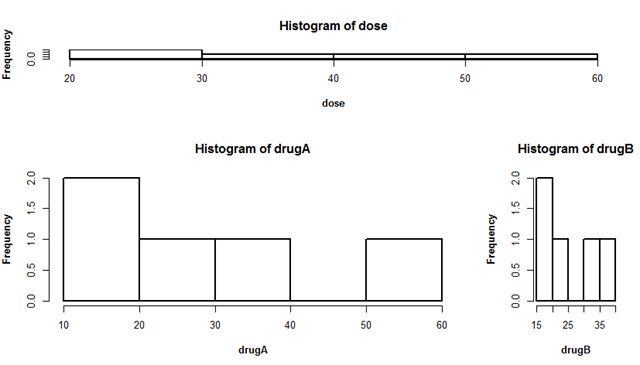
par函数中的参数 nfrow = c(nrows,ncols)用来指定同时画出几幅图,nfcol可以按列设置。上面两幅图在一起的就是用这个参数设置的。
layout()函数后面参数为一个矩阵。比如 layout(matrix(c(1,1,2,3),2,2,byrow = TRUE))表示第一幅图在第一行,第二、三幅图在第二行。layout函数还可以指定两个参数,widths = ,heights = ,分别为宽度和高度向量,这是相对的高度和宽度。想要设置绝对高度党和宽度,需要用lcm()函数,单位为cm.像上面的例子,可以设置widths = c(3,1),heights = c(1,2).这两个参数实际上是对上面的矩阵的行列的比值的设置,即宽度是设置列宽的比,高度是行高的比。
见下图:
请记住,mtcars是datasets中的数据集,我找了好半天……
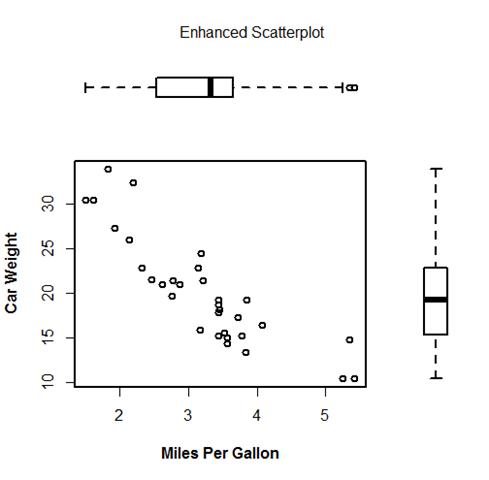
下面是一个例子,用来精细控制图形。
opar <- par(no.readonly = TRUE)
par(fig = c(0,0.8,0,0.8))  #这里的设置是规定画布的80%画下面图形
plot(mtcars$wt,mtcars$mpg,
     xlab = "Miles Per Gallon",
     ylab = "Car Weight")
par(fig = c(0,0.8,0.55,1),new = TRUE)     #上方添加箱型图
boxplot(mtcars$wt,horizontal = TRUE,axes = FALSE)
par(fig = c(0.65,1,0,0.8),new = TRUE)    #右下角添加箱型图
boxplot(mtcars$mpg,axes = FALSE)

mtext("Enhanced Scatterplot",side = 3,outer = TRUE,line = -3)
par(opar)
上面的代码中,par参数,fig = c(x1,x2,y1,y2)是设置横向范围x1-x2,纵向为y1-y2,fig默认会打开新的窗口,所以在参数中设置 new = TRUE,需要说明的是,上面图形的位置是需要不断调整的。
本章只是画图的笼统的、范围较广的设置,后面的各章会有相对的图形个性设置。


