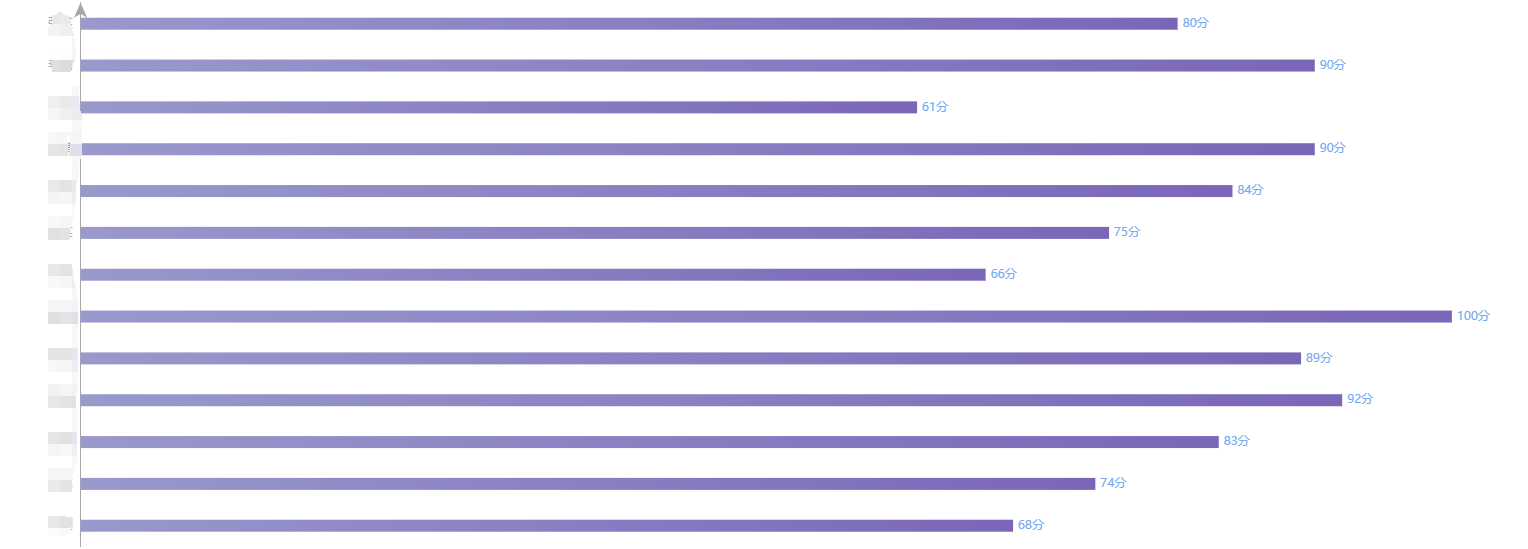
function init1(data) {

    var myChart = echarts.init(echart1.value)
    var option = {
        title: {
            text: '人员送训评估分析',
            x: 'center',
            top:'2%',
        },
        backgroundColor: 'transparent',
        xAxis: {
            // type: 'value',
            axisTick: {
                show: false,
            },
            axisLabel: {
                show: false,
                fontSize: 8
            },
            splitLine: {
                show: false
            }
        },
        yAxis: {
            type: 'category',
            inverse: true,
            namGap: 50,
            axisTick: {
                show: false,
            },
            nameTextStyle: {
                color: '#000'
            },
            axisLine: {
                symbol: ['none', 'arrow'],
                lineStyle: {
                    color: '#a8a8a8',
                    width: 1, //这里是为了突出显示加上的
                }
            },
            data: ['张某', '李某', '王某', '刘某', '包某', '赵某', '孙某', '周某', '吴某', '郑某', '孟某', '宋某', '马某']
        },
        tooltip: {
            trigger: 'axis'
        },
        grid: {
            left: '5%',
            top: '10%',
            right: '10%',
            bottom: '2%',
            containLabel: true
        },
        series: [{
            data: data,
            // name:'存栏',
            type: 'bar',
            barWidth: '12',
            label: {
                show: true,
                position: 'right',
                color: '#76AAF2',
                formatter: '{c}分',
            },
            itemStyle: {

                show: true,
                color:  {
                    type: 'linear',
                    x: 0,
                    y: 0,
                    x2: 1,
                    y2: 0,
                    colorStops: [{
                        offset: 0,
                        color: '#9999CC'
                    }, {
                        offset: 1,
                        color: '#7A66B8'
                    }],
                    //globalCoord: false
                },

            },
        }]
    }
    myChart.setOption(option);
    window.addEventListener('resize', () => {
        myChart.resize();
    })
}


· 阿里巴巴 QwQ-32B真的超越了 DeepSeek R-1吗?
· 10年+ .NET Coder 心语 ── 封装的思维:从隐藏、稳定开始理解其本质意义
· 【设计模式】告别冗长if-else语句:使用策略模式优化代码结构
· 字符编码:从基础到乱码解决
· 提示词工程——AI应用必不可少的技术