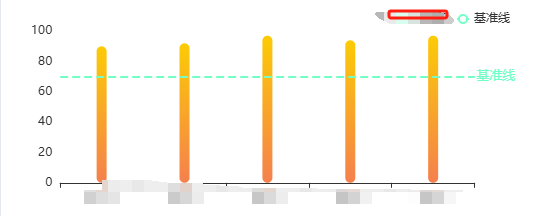
const optionTrain = {
  tooltip: {
    trigger: 'axis'
    // axisPointer: {
    //   // 坐标轴指示器,坐标轴触发有效
    //   type: 'shadow' // 默认为直线,可选为:'line' | 'shadow'
    // }
  },
  grid: {
    left: '2%',
    right: '10%',
    bottom: '6%',
    top: '16%',
    containLabel: true
  },
  legend: {
    // data: ['参训率'],
    right: 10,
    top: 12,
    textStyle: {
      color: '#333'
    },
    itemWidth: 12,
    itemHeight: 10
    // itemGap: 35
  },
  xAxis: {
    type: 'category',
    data: ['某1lv', '某2lv', '某3lv', '某4lv', '某5lv'],
    axisLine: {
      lineStyle: {
        color: '#333'
      }
    },
    axisLabel: {
      // interval: 0,
      // rotate: 40,
      textStyle: {
        fontFamily: 'Microsoft YaHei'
      }
    }
  },

  yAxis: {
    type: 'value',
    axisLine: {
      show: false,
      lineStyle: {
        color: '#333'
      }
    },
    splitLine: {
      show: true,
      lineStyle: {
        color: 'rgba(255,255,255,0.3)'
      }
    },
    axisLabel: {}
  },
  series: [
    {
      name: '参训率',
      type: 'bar',
      barWidth: 10,
      itemStyle: {
        normal: {
          color: new echarts.graphic.LinearGradient(0, 0, 0, 1, [
            {
              offset: 0,
              color: '#fccb05'
            },
            {
              offset: 1,
              color: '#f5804d'
            }
          ]),
          barBorderRadius: 12
        }
      },
      data: [90, 92, 97, 94, 97]
    },
    // 目标值
    {
      name:'基准线',
      type: "line",
      itemStyle: {
        normal: {
          color: new echarts.graphic.LinearGradient(0, 0, 0, 1, [
            {
              offset: 0,
              color: 'rgba(114, 255, 198, 1)'
            },
            {
              offset: 1,
              color: 'rgba(114, 255, 198, 1)'
            }
          ]),
          barBorderRadius: 12
        }
      },
      markLine: {
          //添加警戒线
        symbol: "none",
        name: "基准线",
        silent: true,
        label: {
            position: "end",
            fontSize: '0.875rem',
            distance: 2, // 线和字的颜色
        },
        data: [
          {
            silent: true, //鼠标悬停事件  true没有,false有
            lineStyle: {
              //警戒线的样式  ,虚实  颜色
              type: "dashed",
              color: "rgba(114, 255, 198, 1)",
              width: 2,
            },
            label: {
              formatter: "基准线",
              color: "rgba(114, 255, 198, 1)",
              fontSize: '0.8rem',
            },
            yAxis: "70",
            animation: true,
          }
        ],
      },
    },

  ]
};


